Wayland: Fire Incidents, Massachusetts (MA)
Where are fire incidents reported in Wayland, MA
Something went wrong! Please refresh the page.
| Fire incidents reported | |
|---|---|
| Sreet name | Count |
| BOSTON POST ROAD | 92 |
| STONEBRIDGE ROAD | 80 |
| OLD CONNECTICUT PATH | 54 |
| COMMONWEALTH ROAD | 46 |
| MAIN STREET | 42 |
| CONCORD ROAD | 28 |
| COCHITUATE ROAD | 24 |
| BENT AVENUE | 20 |
| PLAIN ROAD | 18 |
| WEST PLAIN STREET | 18 |
| EAST PLAIN STREET | 16 |
| GREEN WAY | 16 |
| PELHAM ISLAND ROAD | 16 |
| GLEZEN LANE | 14 |
| BARNEY HILL ROAD | 12 |
| OLD SUDBURY ROAD | 12 |
| OXBOW ROAD | 12 |
| SCHOOL STREET | 12 |
| HEARD ROAD | 10 |
| HILLSIDE DRIVE | 10 |
| LAKE ROAD TERRACE | 10 |
| LAKE SHORE DRIVE | 10 |
| LAKEVIEW ROAD | 10 |
| LOKER STREET | 10 |
| MITCHELL STREET | 10 |
| MOORE ROAD | 10 |
| PEQUOT ROAD | 10 |
| RICE ROAD | 10 |
| RICE SPRING LANE | 10 |
| BOSTON POST RD | 8 |
2002 - 2018 National Fire Incident Reporting System (NFIRS) incidents
- Incident types reported to NFIRS in Wayland, MA
- 4,79827.1%Rescue & EMS
- 4,64226.2%Special Incident
- 4,10623.2%Hazardous Condition
- 2,32113.1%Service Call
- 9125.1%False Alarm
- 6063.4%Fire
- 3171.8%Good Intent Call
- Fire incident types reported to NFIRS in Wayland, MA
- 26844.2%Structure Fires
- 21836.0%Outside Fires
- 7011.6%Other
- 508.3%Mobile Property/Vehicle Fires
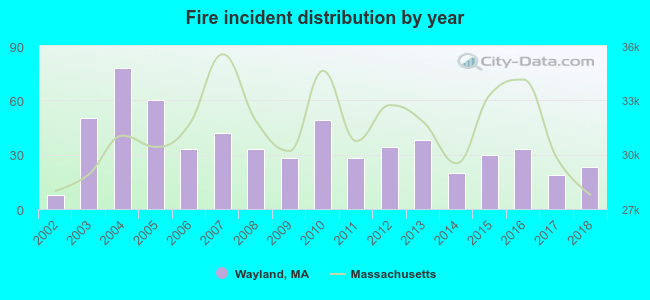 According to the data from the years 2002 - 2018 the average number of fire incidents per year is 36. The highest number of reported fire incidents - 78 took place in 2004, and the least - 8 in 2002. The data has a rising trend.
The average number of yearly fire incidents per 10k residents in Wayland, MA compared to nearest cities:
(Note: Based on data for the last 3 years, including only cities with population 5,000 and above)
| Wayland: | 19.2 |
| Weston: | 34.3 |
| Natick: | 25.0 |
| Wellesley: | 18.2 |
| Sudbury: | 15.3 |
| Framingham: | 89.7 |
| Lincoln: | 111.1 |
| Waltham: | 31.2 |
| Newton: | 29.6 |
 The median response time based on all reported fire incidents is 3 minutes. This is lower compared to the state median value.
The median response time in Wayland, MA compared to nearest cities:
(Note: Based on data for all years, including only cities with at least 500 fire incidents)
| Wayland: | 3 minutes |
| Weston: | 4 minutes |
| Natick: | 5 minutes |
| Wellesley: | 4 minutes |
| Sudbury: | 4 minutes |
| Framingham: | 4 minutes |
| Lincoln: | 5 minutes |
| Waltham: | 4 minutes |
| Newton: | 5 minutes |
 According to the reports from the years 2002 - 2018 the average number of fire-related casualties per year is 0. The highest number of reported injuries - 3 took place in 2011, and the lowest - 0 in 2003. The data has a dropping trend.
The average number of injuries per 1,000 fires is 18. This indicator was the highest - 125 in 2002, and the lowest 0 in 2003. The trend for casualties per 1,000 fire incidents is dropping. Compared to the Massachusetts value the number of casualties per 1,000 incidents is about the same.
According to the reports from the years 2002 - 2018 the average number of fire-related casualties per year is 0. The highest number of reported injuries - 3 took place in 2011, and the lowest - 0 in 2003. The data has a dropping trend.
The average number of injuries per 1,000 fires is 18. This indicator was the highest - 125 in 2002, and the lowest 0 in 2003. The trend for casualties per 1,000 fire incidents is dropping. Compared to the Massachusetts value the number of casualties per 1,000 incidents is about the same.
 33.2% incidents where reported in the morning and 66.8% in the evening. The most fires (16.0%) took place on Wednesday, and the least (12.9%) on Friday.
 According to the 606 fire incidents from years 2002 - 2018 most fires (14.5%) took place during April, and the least (4.6%) in February.
 Out of all 17,713 cases reported during the years 2002 - 2018, the most belonged to the categories: Rescue & EMS (27.1%), Special Incident (26.2%), and Hazardous Condition (23.2%).
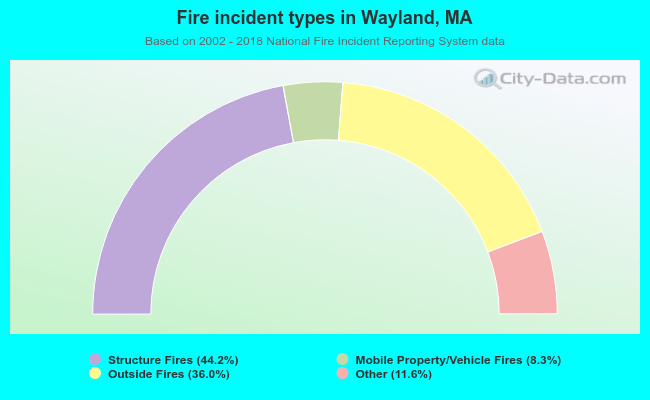 When looking into fire subcategories, the most reports belonged to: Structure Fires (44.2%), and Outside Fires (36.0%).