Waukegan: Fire Incidents, Illinois (IL)
Where are fire incidents reported in Waukegan, IL
Something went wrong! Please refresh the page.
| Fire incidents reported | |
|---|---|
| Sreet name | Count |
| LEWIS AV | 356 |
| BELVIDERE RD | 336 |
| GREEN BAY RD | 322 |
| WASHINGTON ST | 282 |
| DUGDALE RD | 258 |
| GRAND AV | 212 |
| GENESEE ST | 202 |
| GLEN FLORA AV | 192 |
| JACKSON ST | 176 |
| BUTRICK ST | 160 |
| SHERIDAN RD | 156 |
| MARTIN LUTHER KING AV | 152 |
| LAKE ST | 134 |
| 8TH ST | 128 |
| SUNSET AV | 120 |
| MCAREE RD | 112 |
| GRANDVILLE AV | 106 |
| PINE ST | 102 |
| GREENWOOD AV | 100 |
| COUNTY ST | 98 |
| JULIAN ST | 80 |
| 10TH ST | 78 |
| FRANKLIN ST | 72 |
| GOLF RD | 72 |
| LEWIS | 72 |
| BROOKSIDE AV | 66 |
| ELMWOOD AV | 66 |
| LAKEHURST RD | 66 |
| BLANCHARD RD | 64 |
| CHESTNUT ST | 64 |
| Other | 579 |
2002 - 2018 National Fire Incident Reporting System (NFIRS) incidents
- Incident types reported to NFIRS in Waukegan, IL
- 35,21658.3%Rescue & EMS
- 7,18311.9%Good Intent Call
- 6,40510.6%False Alarm
- 4,9838.3%Fire
- 4,8748.1%Hazardous Condition
- 1,5612.6%Service Call
- 680.1%Overpressure Rupture
- Fire incident types reported to NFIRS in Waukegan, IL
- 2,59452.1%Structure Fires
- 1,40528.2%Outside Fires
- 76815.4%Mobile Property/Vehicle Fires
- 2164.3%Other
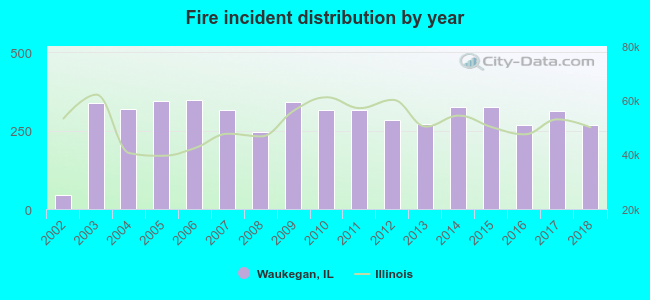 Based on the data from the years 2002 - 2018 the average number of fires per year is 293. The highest number of reported fires - 347 took place in 2006, and the least - 44 in 2002. The data has a rising trend.
The average number of yearly fire incidents per 10k residents in Waukegan, IL compared to nearest cities:
(Note: Based on data for the last 3 years, including only cities with population 5,000 and above)
| Waukegan: | 31.8 |
| Park City: | 14.8 |
| North Chicago: | 29.5 |
| Beach Park: | 45.0 |
| Gurnee: | 23.7 |
| Zion: | 55.8 |
| Lake Bluff: | 55.0 |
| Gages Lake: | 1.3 |
| Winthrop Harbor: | 34.2 |
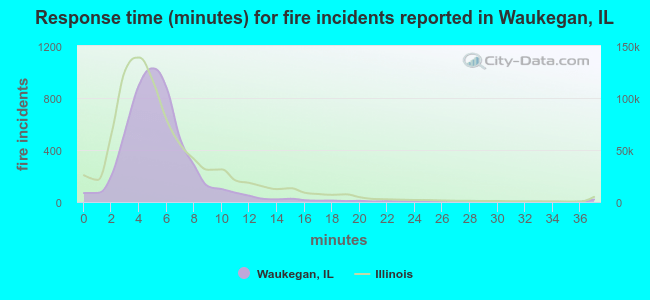 The median response time based on all reported fire incidents is 5 minutes. This is about the same as the state median value.
The median response time in Waukegan, IL compared to nearest cities:
(Note: Based on data for all years, including only cities with at least 500 fire incidents)
| Waukegan: | 5 minutes |
| North Chicago: | 3 minutes |
| Beach Park: | 6 minutes |
| Gurnee: | 6 minutes |
| Wadsworth: | 7 minutes |
| Zion: | 5 minutes |
| Lake Bluff: | 5 minutes |
| Winthrop Harbor: | 5 minutes |
| Libertyville: | 5 minutes |
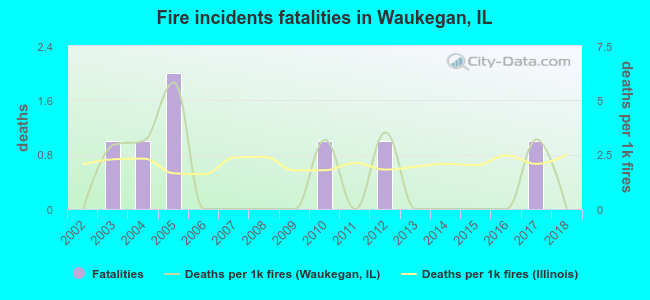 Based on the reports from the years 2002 - 2018 the average number of fire-related yearly deaths is 0. The highest number of reported deaths - 2 took place in 2005, and the lowest - 0 in 2002. The data has a constant trend.
The average number of deaths per 1,000 fires is 1. This indicator was the highest - 6 in 2005, and the lowest 0 in 2002. The trend for deaths per 1,000 incidents is constant. Compared to the Illinois value the number of fatalities per 1,000 incidents is lower.
Based on the reports from the years 2002 - 2018 the average number of fire-related yearly deaths is 0. The highest number of reported deaths - 2 took place in 2005, and the lowest - 0 in 2002. The data has a constant trend.
The average number of deaths per 1,000 fires is 1. This indicator was the highest - 6 in 2005, and the lowest 0 in 2002. The trend for deaths per 1,000 incidents is constant. Compared to the Illinois value the number of fatalities per 1,000 incidents is lower.Deaths per 1,000 incidents in Waukegan, IL compared to nearest cities:
(Note: Based on data for all years, including only cities with at least 2,500 fire incidents)
| Waukegan: | 1.4 |
| Libertyville: | 0.3 |
| Palatine: | 1.3 |
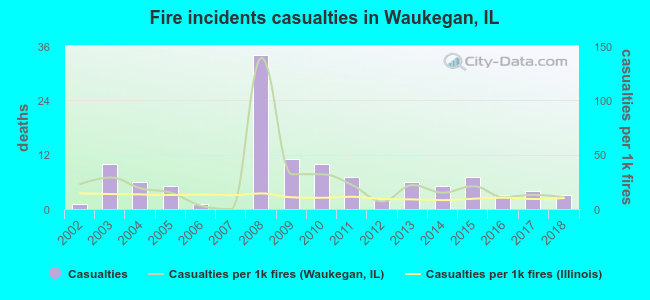 Based on the data from the years 2002 - 2018 the average number of fire-related casualties per year is 7. The highest number of reported casualties - 34 took place in 2008, and the lowest - 0 in 2007. The data has a growing trend.
The average number of casualties per 1,000 fires is 24. This indicator was the highest - 139 in 2008, and the lowest 0 in 2007. The trend for injuries per 1,000 incidents is dropping. Compared to the state value the number of injuries per 1,000 fires is much higher.
Based on the data from the years 2002 - 2018 the average number of fire-related casualties per year is 7. The highest number of reported casualties - 34 took place in 2008, and the lowest - 0 in 2007. The data has a growing trend.
The average number of casualties per 1,000 fires is 24. This indicator was the highest - 139 in 2008, and the lowest 0 in 2007. The trend for injuries per 1,000 incidents is dropping. Compared to the state value the number of injuries per 1,000 fires is much higher.Casualties per 1,000 incidents in Waukegan, IL compared to nearest cities:
(Note: Based on data for all years, including only cities with at least 500 fire incidents)
| Waukegan: | 23.1 |
| North Chicago: | 6.9 |
| Beach Park: | 8.1 |
| Gurnee: | 25.4 |
| Wadsworth: | 5.1 |
| Zion: | 11.7 |
| Lake Bluff: | 9.5 |
| Winthrop Harbor: | 15.2 |
| Libertyville: | 4.3 |
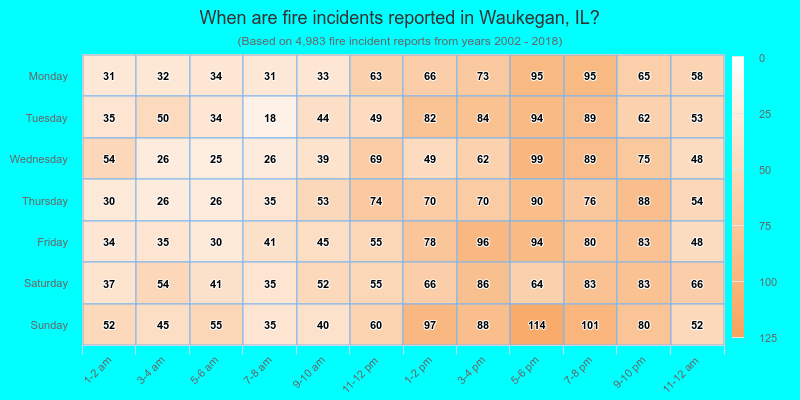
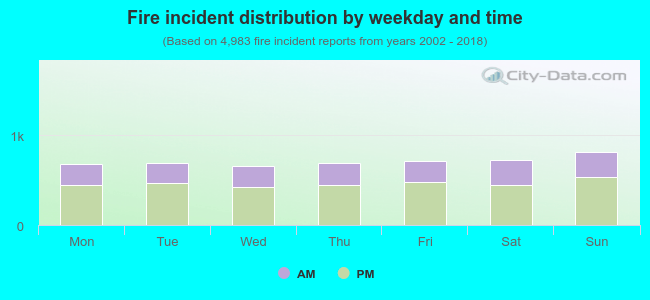 34.9% incidents where reported in the morning and 65.1% in the evening. The most fires (16.4%) took place on Sunday, and the least (13.3%) on Wednesday.
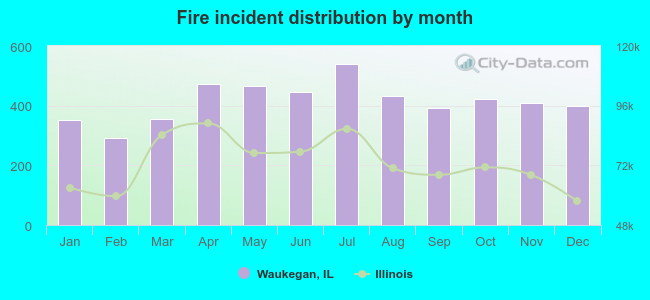 Based on the 4,983 fire incident reports from years 2002 - 2018 most fires (10.8%) took place during July, and the least (5.9%) in February.
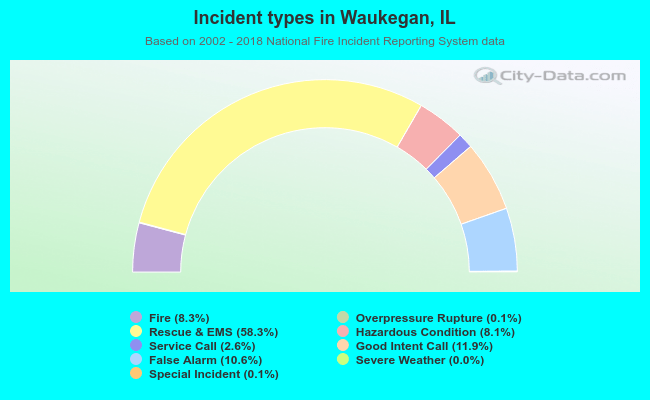 Out of all 60,357 cases reported during the years 2002 - 2018, the most belonged to the categories: Rescue & EMS (58.3%), Good Intent Call (11.9%), and False Alarm (10.6%).
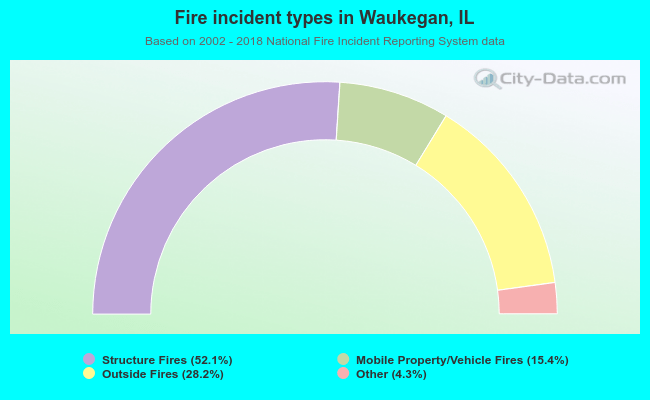 When looking into fire subcategories, the most incidents belonged to: Structure Fires (52.1%), and Outside Fires (28.2%).