Park City: Fire Incidents, Illinois (IL)
Where are fire incidents reported in Park City, IL
Something went wrong! Please refresh the page.
|
| |||||||||||||||||||||||||||||||||||||||||||||||||||||||||||||||||||||||||||||||||||||||||||||||||||||||||||||
2002 - 2018 National Fire Incident Reporting System (NFIRS) incidents
- Incident types reported to NFIRS in Park City, IL
- 2,11864.8%Rescue & EMS
- 2858.7%Hazardous Condition
- 2778.5%False Alarm
- 2126.5%Fire
- 2076.3%Good Intent Call
- 1604.9%Service Call
- 50.2%Overpressure Rupture
- 40.1%Special Incident
- Fire incident types reported to NFIRS in Park City, IL
- 11152.4%Structure Fires
- 4923.1%Outside Fires
- 4320.3%Mobile Property/Vehicle Fires
- 94.2%Other
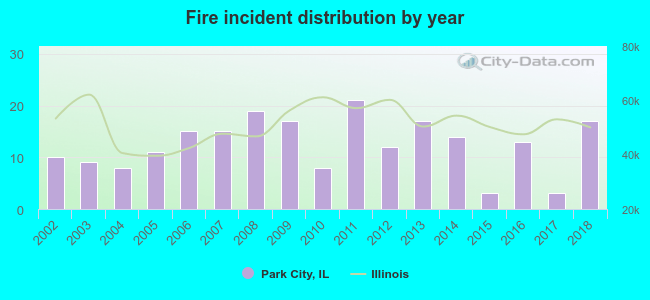 Based on the data from the years 2002 - 2018 the average number of fires per year is 12. The highest number of fire incidents - 21 took place in 2011, and the least - 3 in 2015. The data has an increasing trend.
The average number of yearly fire incidents per 10k residents in Park City, IL compared to nearest cities:
(Note: Based on data for the last 3 years, including only cities with population 5,000 and above)
| Park City: | 14.8 |
| Waukegan: | 31.8 |
| North Chicago: | 29.5 |
| Gurnee: | 23.7 |
| Gages Lake: | 1.3 |
| Lake Bluff: | 55.0 |
| Beach Park: | 45.0 |
| Libertyville: | 43.1 |
| Grayslake: | 33.6 |
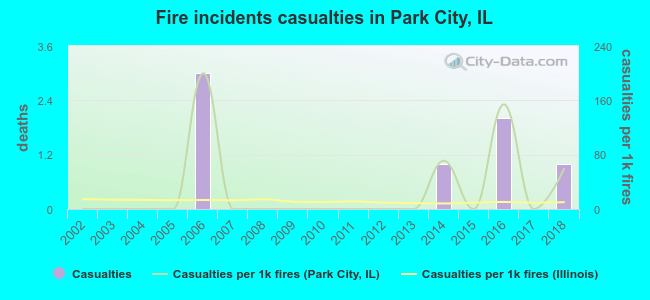 According to the reports from the years 2002 - 2018 the average number of fire-related yearly casualties is 0. The highest number of reported casualties - 3 took place in 2006, and the lowest - 0 in 2002. The data has a growing trend.
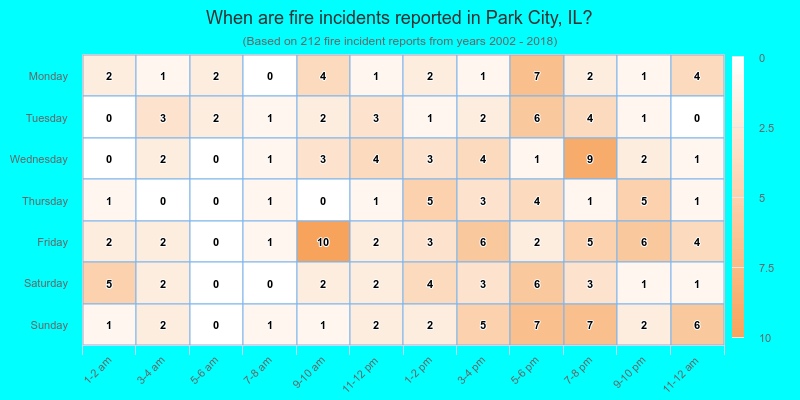
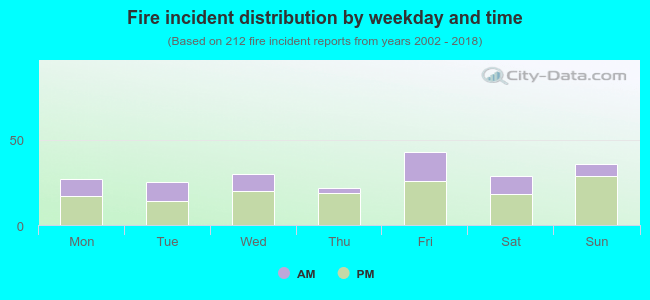 32.5% incidents where reported in the morning and 67.5% in the evening. The most fires (20.3%) took place on Friday, and the least (10.4%) on Thursday.
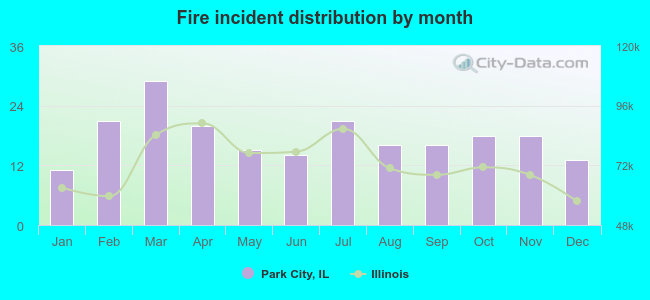 According to the 212 incident reports from years 2002 - 2018 most fires (13.7%) took place during March, and the least (5.2%) in January.
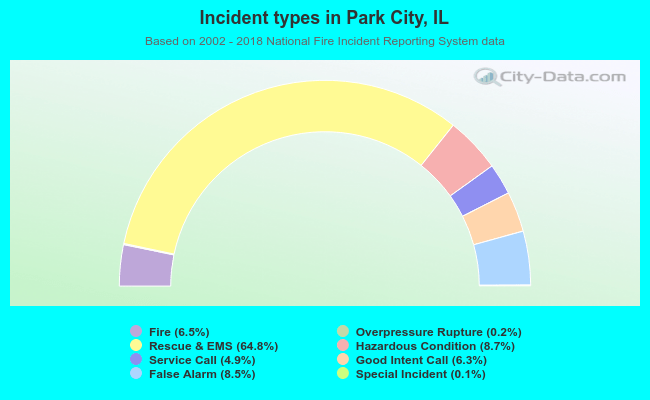 Out of all 3,268 cases reported during the years 2002 - 2018, the most belonged to the categories: Rescue & EMS (64.8%), Hazardous Condition (8.7%), and False Alarm (8.5%).
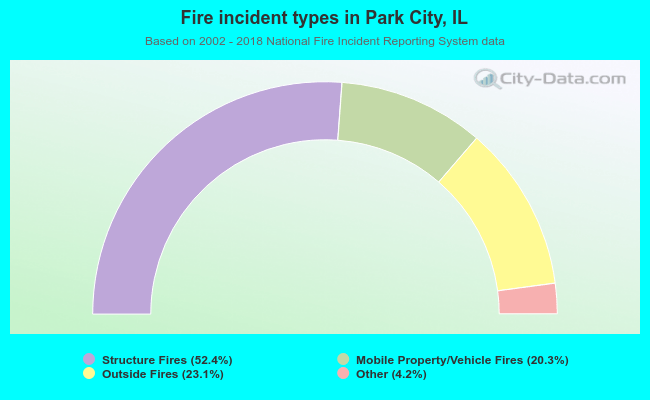 When looking into fire subcategories, the most reports belonged to: Structure Fires (52.4%), and Outside Fires (23.1%).