Washington Park: Fire Incidents, Illinois (IL)
Where are fire incidents reported in Washington Park, IL
Something went wrong! Please refresh the page.
| Fire incidents reported | |
|---|---|
| Sreet name | Count |
| FOREST BLVD | 124 |
| CASEYVILLE AVE | 96 |
| 49TH ST | 80 |
| KINGSHIGHWAY | 72 |
| BUNKUM RD | 66 |
| KINGSHIGHWAY HWY | 58 |
| 48 ST | 46 |
| HALLOWS AVE | 46 |
| 52 ST | 44 |
| HALLOWS | 44 |
| 56 ST | 40 |
| 58TH ST | 38 |
| 48TH ST | 36 |
| 51 ST | 36 |
| 53 ST | 36 |
| 60TH ST | 36 |
| CASEYVILLE AVE | 36 |
| HALLOWS ST | 36 |
| 49 ST | 34 |
| 50 ST | 34 |
| 47 ST | 32 |
| 56TH ST | 30 |
| 48TH | 28 |
| 53RD ST | 28 |
| 60 ST | 28 |
| 62 ST | 26 |
| 64 HWY | 26 |
| FOREST BLVD | 26 |
| ROSEMONT ST | 26 |
| 47TH ST | 24 |
| Other | 672 |
2003 - 2018 National Fire Incident Reporting System (NFIRS) incidents
- Incident types reported to NFIRS in Washington Park, IL
- 1,98480.6%Fire
- 2249.1%Hazardous Condition
- 973.9%Rescue & EMS
- 562.3%False Alarm
- 552.2%Service Call
- 401.6%Good Intent Call
- 30.1%Overpressure Rupture
- Fire incident types reported to NFIRS in Washington Park, IL
- 1,29465.2%Structure Fires
- 46723.5%Outside Fires
- 1698.5%Mobile Property/Vehicle Fires
- 542.7%Other
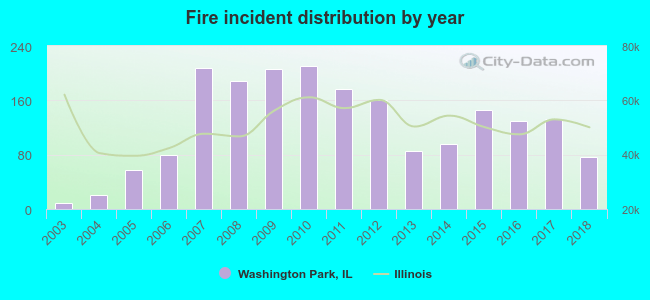 Based on the data from the years 2003 - 2018 the average number of fire incidents per year is 124. The highest number of fires - 211 took place in 2010, and the least - 9 in 2003. The data has an increasing trend.
 The median response time based on all reported fire incidents is 5 minutes. This is close to the state median value.
The median response time in Washington Park, IL compared to nearest cities:
(Note: Based on data for all years, including only cities with at least 500 fire incidents)
| Washington Park: | 5 minutes |
| East St. Louis: | 6 minutes |
| Centreville: | 7 minutes |
| Caseyville: | 6 minutes |
| Alorton: | 5 minutes |
| Madison: | 6 minutes |
| Fairview Heights: | 5 minutes |
| Collinsville: | 5 minutes |
| Cahokia: | 7 minutes |
 According to the reports from the years 2003 - 2018 the average number of fire-related fatalities per year is 0. The highest number of reported deaths - 2 took place in 2006, and the lowest - 0 in 2003. The data has a constant trend.
 According to the data from the years 2003 - 2018 the average number of fire-related casualties per year is 0. The highest number of reported casualties - 3 took place in 2010, and the lowest - 0 in 2003. The data has a constant trend.
The average number of injuries per 1,000 fires is 2. This indicator was the highest - 14 in 2010, and the lowest 0 in 2003. The trend for casualties per 1,000 fire incidents is constant. Compared to the Illinois value the number of casualties per 1,000 incidents is much lower.
According to the data from the years 2003 - 2018 the average number of fire-related casualties per year is 0. The highest number of reported casualties - 3 took place in 2010, and the lowest - 0 in 2003. The data has a constant trend.
The average number of injuries per 1,000 fires is 2. This indicator was the highest - 14 in 2010, and the lowest 0 in 2003. The trend for casualties per 1,000 fire incidents is constant. Compared to the Illinois value the number of casualties per 1,000 incidents is much lower.Casualties per 1,000 incidents in Washington Park, IL compared to nearest cities:
(Note: Based on data for all years, including only cities with at least 500 fire incidents)
| Washington Park: | 3.0 |
| East St. Louis: | 2.3 |
| Centreville: | 0.0 |
| Caseyville: | 1.5 |
| Alorton: | 0.0 |
| Madison: | 2.0 |
| Fairview Heights: | 17.3 |
| Collinsville: | 16.9 |
| Cahokia: | 9.4 |
 43.8% incidents where reported in the morning and 56.3% in the evening. The most fires (15.5%) took place on Sunday, and the least (11.4%) on Thursday.
 According to the 1,984 reports from years 2003 - 2018 most fires (10.7%) took place during July, and the least (6.7%) in September.
 Out of all 2,461 cases reported during the years 2003 - 2018, the most belonged to the categories: Fire (80.6%), Hazardous Condition (9.1%), and Rescue & EMS (3.9%).
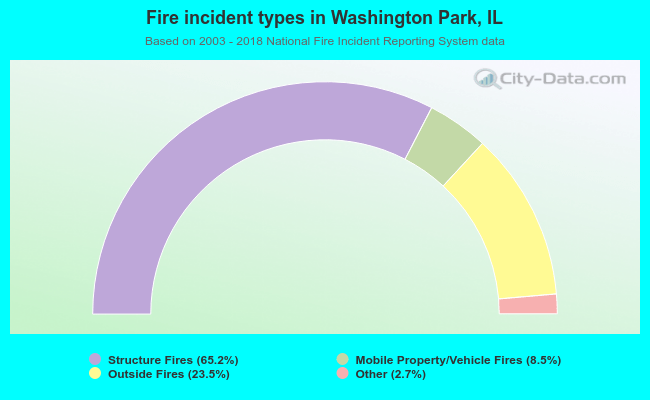 When looking into fire subcategories, the most reports belonged to: Structure Fires (65.2%), and Outside Fires (23.5%).