Centreville: Fire Incidents, Illinois (IL)
Where are fire incidents reported in Centreville, IL
Something went wrong! Please refresh the page.
| Fire incidents reported | |
|---|---|
| Sreet name | Count |
| OLD MISSOURI AVE | 82 |
| LAKE DR | 80 |
| BOND AVE | 70 |
| TUDOR AVE | 64 |
| 88TH ST | 50 |
| CHURCH RD | 40 |
| JEFFERSON | 40 |
| AMES | 38 |
| PIGGOTT AVE | 38 |
| TRENDLEY AVE | 38 |
| 73RD ST | 34 |
| 82ND ST | 34 |
| BAKER | 30 |
| BATES | 30 |
| POCKET RD | 30 |
| 82 | 26 |
| BAKER AVE | 26 |
| CLARITA ST | 26 |
| GAY AVE | 26 |
| GOLDEN | 26 |
| GOLDEN ST | 26 |
| MARKET AVE | 26 |
| 26 | |
| TRENDLEY | 24 |
| TUDOR | 24 |
| 81ST ST | 22 |
| BOND | 22 |
| JEFFERSON ST | 22 |
| PIGGOT | 22 |
| 40TH ST | 20 |
| Other | 370 |
2003 - 2018 National Fire Incident Reporting System (NFIRS) incidents
- Incident types reported to NFIRS in Centreville, IL
- 1,43254.5%Fire
- 44516.9%False Alarm
- 30511.6%Hazardous Condition
- 1606.1%Good Intent Call
- 1586.0%Rescue & EMS
- 1204.6%Service Call
- 60.2%Severe Weather
- 30.1%Special Incident
- Fire incident types reported to NFIRS in Centreville, IL
- 72050.3%Structure Fires
- 49434.5%Outside Fires
- 15610.9%Mobile Property/Vehicle Fires
- 624.3%Other
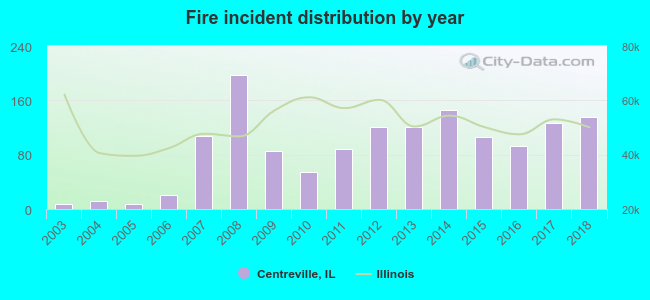 According to the data from the years 2003 - 2018 the average number of fires per year is 89. The highest number of reported fire incidents - 197 took place in 2008, and the least - 7 in 2005. The data has a growing trend.
The average number of yearly fire incidents per 10k residents in Centreville, IL compared to nearest cities:
(Note: Based on data for the last 3 years, including only cities with population 5,000 and above)
| Centreville: | 233.1 |
| Cahokia: | 146.7 |
| Fairview Heights: | 48.7 |
| Swansea: | 29.8 |
| Belleville: | 74.5 |
| Collinsville: | 53.9 |
| Granite City: | 49.8 |
| Pontoon Beach: | 67.6 |
| Shiloh: | 5.4 |
 The median response time based on all reported fire incidents is 7 minutes. This is higher than the state median value.
The median response time in Centreville, IL compared to nearest cities:
(Note: Based on data for all years, including only cities with at least 500 fire incidents)
| Centreville: | 7 minutes |
| Alorton: | 5 minutes |
| East St. Louis: | 6 minutes |
| Washington Park: | 5 minutes |
| Cahokia: | 7 minutes |
| Caseyville: | 6 minutes |
| Fairview Heights: | 5 minutes |
| Swansea: | 5 minutes |
| Belleville: | 4 minutes |
 40.2% incidents where reported in the morning and 59.8% in the evening. The most fires (16.6%) took place on Monday, and the least (12.0%) on Thursday.
 According to the 1,432 fire incident reports from years 2003 - 2018 most fires (11.2%) took place during July, and the least (6.4%) in September.
 Out of all 2,629 cases reported during the years 2003 - 2018, the most belonged to the categories: Fire (54.5%), Good Intent Call (16.9%), and Rescue & EMS (11.6%).
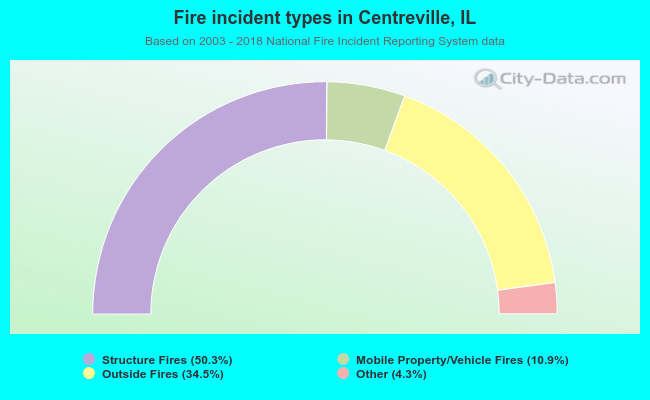 When looking into fire subcategories, the most incidents belonged to: Structure Fires (50.3%), and Outside Fires (34.5%).