Wailea: Fire Incidents, Hawaii (HI)
Where are fire incidents reported in Wailea, HI
Something went wrong! Please refresh the page.
|
| |||||||||||||||||||||||||||||||||||||||||||||||||||||||||||||||||||||||||||||||||||||||||||||||||||||||||||||
2006 - 2018 National Fire Incident Reporting System (NFIRS) incidents
- Incident types reported to NFIRS in Wailea, HI
- 1,22859.2%Rescue & EMS
- 35317.0%Good Intent Call
- 1788.6%False Alarm
- 1246.0%Fire
- 1014.9%Service Call
- 864.1%Hazardous Condition
- Fire incident types reported to NFIRS in Wailea, HI
- 5342.7%Outside Fires
- 4334.7%Structure Fires
- 2520.2%Mobile Property/Vehicle Fires
- 32.4%Other
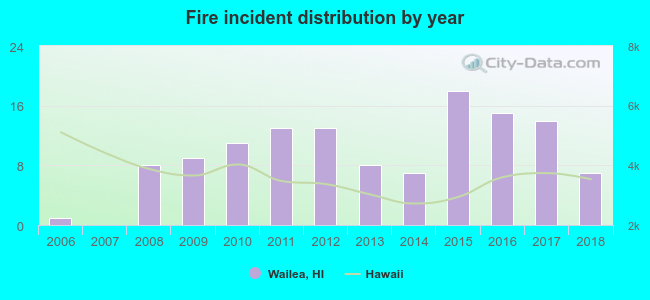 Based on the data from the years 2006 - 2018 the average number of fires per year is 10. The highest number of fire incidents - 18 took place in 2015, and the least - 0 in 2007. The data has a growing trend.
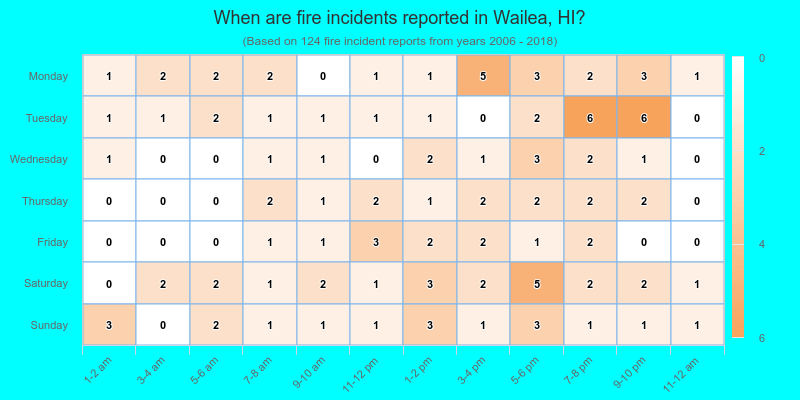
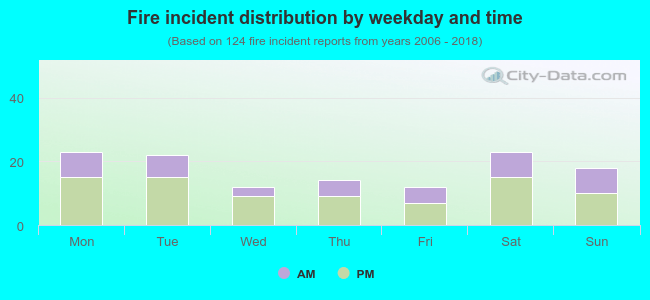 35.5% incidents where reported in the morning and 64.5% in the evening. The most fires (18.5%) took place on Monday, and the least (9.7%) on Wednesday.
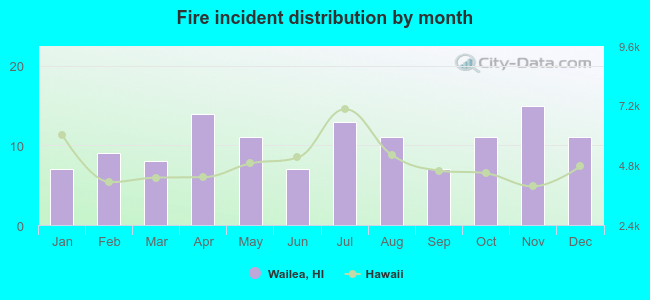 Based on the 124 fire incident reports from years 2006 - 2018 most fires (12.1%) took place during November, and the least (5.6%) in January.
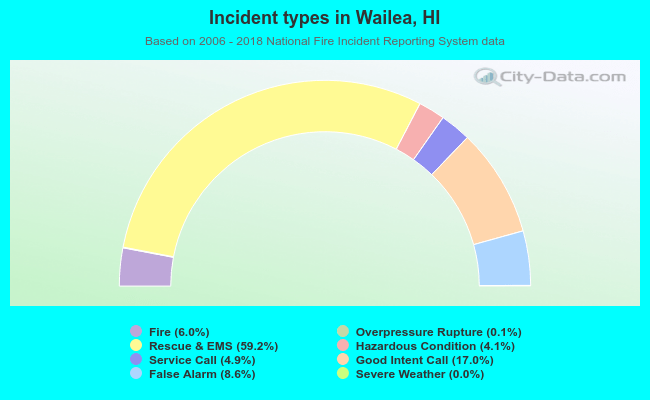 Out of all 2,073 cases reported during the years 2006 - 2018, the most belonged to the categories: Rescue & EMS (59.2%), Good Intent Call (17.0%), and False Alarm (8.6%).
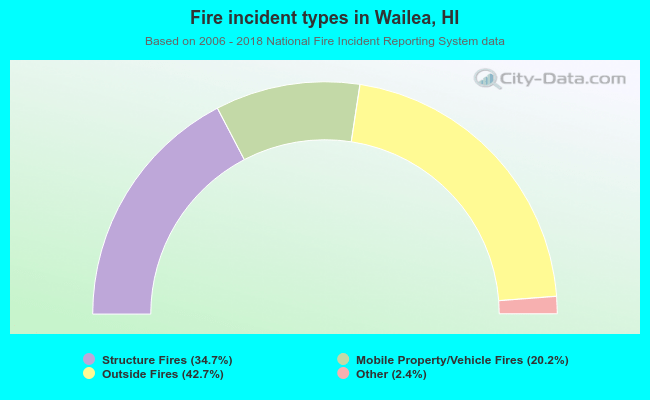 When looking into fire subcategories, the most reports belonged to: Outside Fires (42.7%), and Structure Fires (34.7%).