Pukalani: Fire Incidents, Hawaii (HI)
Where are fire incidents reported in Pukalani, HI
Something went wrong! Please refresh the page.
|
| |||||||||||||||||||||||||||||||||||||||||||||||||||||||||||||||||||||||||||||||||||||||||||||||||||||||||||||
2002 - 2018 National Fire Incident Reporting System (NFIRS) incidents
- Incident types reported to NFIRS in Pukalani, HI
- 1,38463.4%Rescue & EMS
- 26812.3%Fire
- 1878.6%Good Intent Call
- 1758.0%Service Call
- 934.3%Hazardous Condition
- 753.4%False Alarm
- Fire incident types reported to NFIRS in Pukalani, HI
- 11944.4%Outside Fires
- 10137.7%Mobile Property/Vehicle Fires
- 4717.5%Structure Fires
- 10.4%Other
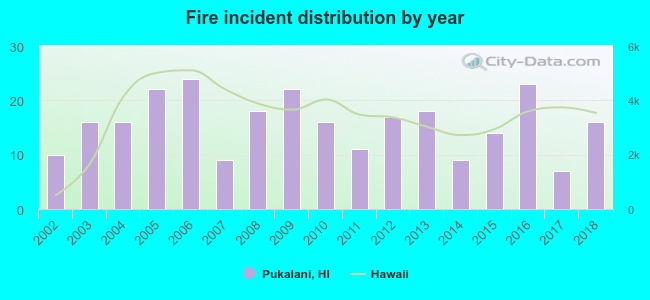 Based on the data from the years 2002 - 2018 the average number of fires per year is 16. The highest number of fire incidents - 24 took place in 2006, and the least - 7 in 2017. The data has a growing trend.
The average number of yearly fire incidents per 10k residents in Pukalani, HI compared to nearest cities:
(Note: Based on data for the last 3 years, including only cities with population 5,000 and above)
| Pukalani: | 20.2 |
| Makawao: | 20.4 |
| Kula: | 34.5 |
| Kahului: | 29.2 |
| Kihei: | 28.1 |
| Wailuku: | 23.3 |
| Lahaina: | 60.1 |
| Waimea: | 11.6 |
| Kailua: | 43.7 |
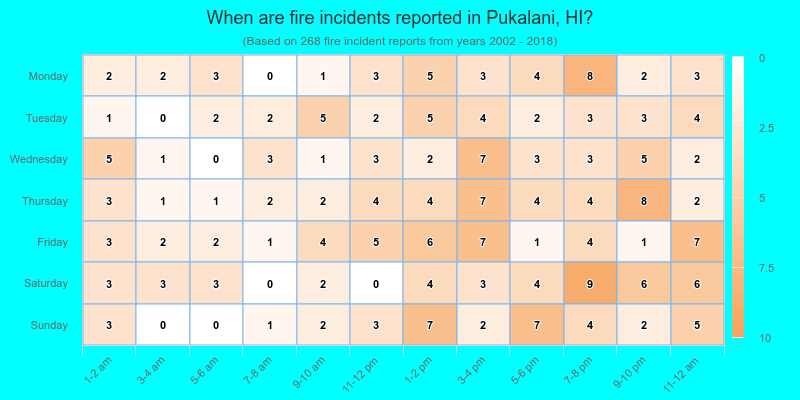
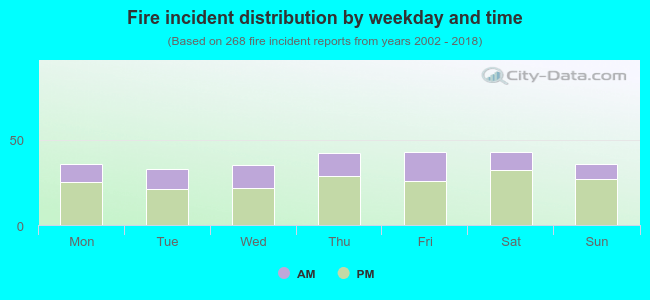 32.1% incidents where reported in the morning and 67.9% in the evening. The most fires (16.0%) took place on Friday, and the least (12.3%) on Tuesday.
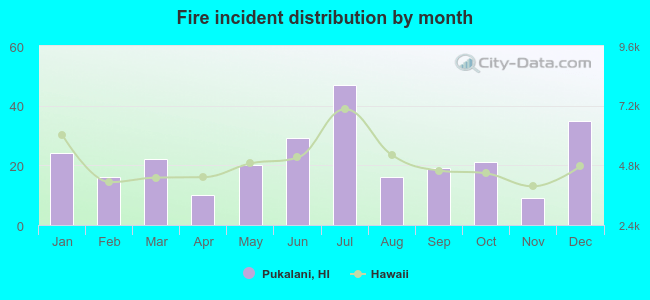 Based on the 268 fire incident reports from years 2002 - 2018 most fires (17.5%) took place during July, and the least (3.4%) in November.
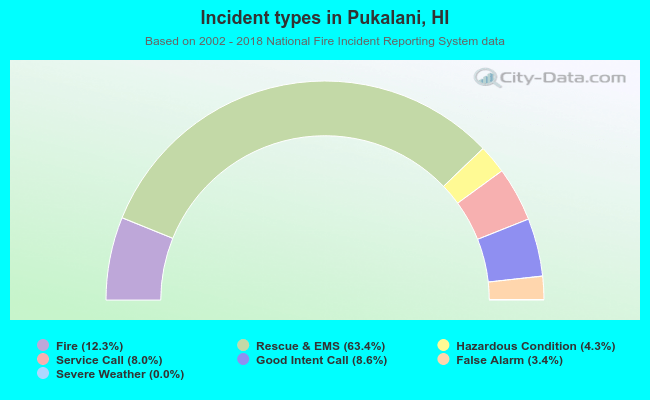 Out of all 2,183 cases reported during the years 2002 - 2018, the most belonged to the categories: Overpressure Rupture (63.4%), Fire (12.3%), and Service Call (8.6%).
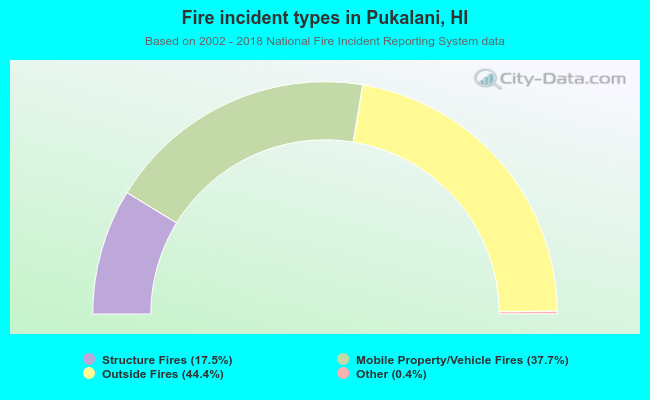 When looking into fire subcategories, the most reports belonged to: Outside Fires (44.4%), and Mobile Property/Vehicle Fires (37.7%).