Victoria: Fire Incidents, Texas (TX)
Where are fire incidents reported in Victoria, TX
Something went wrong! Please refresh the page.
| Fire incidents reported | |
|---|---|
| Sreet name | Count |
| NAVARRO ST | 562 |
| FM 236 | 346 |
| FM 1686 | 266 |
| MOODY ST | 222 |
| US HWY 59 N | 206 |
| FM 616 | 200 |
| JOHN STOCKBAUER DR | 200 |
| BEN JORDAN ST | 186 |
| LOOP 463 | 184 |
| US HWY 77 | 182 |
| LAURENT ST | 180 |
| FM 446 | 178 |
| LOWER MISSION VALLEY RD | 176 |
| SAM HOUSTON DR | 172 |
| COLETOVILLE RD | 156 |
| MOCKINGBIRD LN | 146 |
| AIRLINE RD | 142 |
| MAIN ST | 138 |
| STATE HWY 185 NB | 132 |
| US HWY 59 | 132 |
| US HWY 87 | 130 |
| LONE TREE RD | 128 |
| RED RIVER ST | 128 |
| RIO GRANDE ST | 124 |
| OLD GOLIAD RD | 116 |
| US HWY 77 S | 116 |
| GUADALUPE RD | 110 |
| HOUSTON HWY | 110 |
| FM 447 | 108 |
| KEMPER CITY RD | 108 |
| Other | 4,476 |
2002 - 2018 National Fire Incident Reporting System (NFIRS) incidents
- Incident types reported to NFIRS in Victoria, TX
- 41,14459.5%Rescue & EMS
- 9,76014.1%Fire
- 6,8249.9%Hazardous Condition
- 6,4919.4%Good Intent Call
- 2,5193.6%Service Call
- 2,1603.1%False Alarm
- 1780.3%Overpressure Rupture
- Fire incident types reported to NFIRS in Victoria, TX
- 6,14763.0%Outside Fires
- 2,16722.2%Structure Fires
- 1,39714.3%Mobile Property/Vehicle Fires
- 490.5%Other
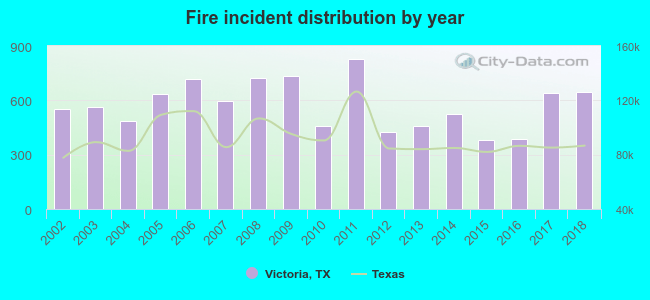 According to the data from the years 2002 - 2018 the average number of fire incidents per year is 574. The highest number of reported fire incidents - 830 took place in 2011, and the least - 383 in 2015. The data has an increasing trend.
The average number of yearly fire incidents per 10k residents in Victoria, TX compared to nearest cities:
(Note: Based on data for the last 3 years, including only cities with population 5,000 and above)
| Victoria: | 84.6 |
| Edna: | 127.8 |
| Port Lavaca: | 44.8 |
| Cuero: | 49.1 |
| Yoakum: | 110.2 |
| El Campo: | 78.3 |
| Rockport: | 82.0 |
| Gonzales: | 119.7 |
| Sinton: | 18.6 |
 The median response time based on all reported fire incidents is 9 minutes. This is higher compared to the state median value.
The median response time in Victoria, TX compared to nearest cities:
(Note: Based on data for all years, including only cities with at least 500 fire incidents)
| Victoria: | 9 minutes |
| Bloomington: | 15 minutes |
| Edna: | 8 minutes |
| Port Lavaca: | 5 minutes |
| Cuero: | 7 minutes |
| Yoakum: | 6 minutes |
| Refugio: | 10 minutes |
| Hallettsville: | 11 minutes |
| El Campo: | 5 minutes |
 Based on the data from the years 2002 - 2018 the average number of fire-related fatalities per year is 1. The highest number of reported deaths - 6 took place in 2006, and the lowest - 0 in 2003. The data has a decreasing trend.
The average number of deaths per 1,000 fire incidents is 1. This indicator was the highest - 8 in 2006, and the lowest 0 in 2003. The trend for deaths per 1,000 fire incidents is declining. Compared to the Texas value the number of fatalities per 1,000 fires is lower.
Based on the data from the years 2002 - 2018 the average number of fire-related fatalities per year is 1. The highest number of reported deaths - 6 took place in 2006, and the lowest - 0 in 2003. The data has a decreasing trend.
The average number of deaths per 1,000 fire incidents is 1. This indicator was the highest - 8 in 2006, and the lowest 0 in 2003. The trend for deaths per 1,000 fire incidents is declining. Compared to the Texas value the number of fatalities per 1,000 fires is lower.Deaths per 1,000 incidents in Victoria, TX compared to nearest cities:
(Note: Based on data for all years, including only cities with at least 2,500 fire incidents)
| Victoria: | 1.1 |
 Based on the data from the years 2002 - 2018 the average number of fire-related yearly casualties is 5. The highest number of casualties - 9 took place in 2004, and the lowest - 2 in 2008. The data has a declining trend.
The average number of injuries per 1,000 fires is 10. This indicator was the highest - 23 in 2016, and the lowest 3 in 2008. The trend for casualties per 1,000 fires is dropping. Compared to the state value the number of casualties per 1,000 fire incidents is similar.
Based on the data from the years 2002 - 2018 the average number of fire-related yearly casualties is 5. The highest number of casualties - 9 took place in 2004, and the lowest - 2 in 2008. The data has a declining trend.
The average number of injuries per 1,000 fires is 10. This indicator was the highest - 23 in 2016, and the lowest 3 in 2008. The trend for casualties per 1,000 fires is dropping. Compared to the state value the number of casualties per 1,000 fire incidents is similar.Casualties per 1,000 incidents in Victoria, TX compared to nearest cities:
(Note: Based on data for all years, including only cities with at least 500 fire incidents)
| Victoria: | 9.1 |
| Bloomington: | 7.3 |
| Edna: | 5.5 |
| Port Lavaca: | 0.0 |
| Cuero: | 0.0 |
| Yoakum: | 8.9 |
| Refugio: | 1.9 |
| Hallettsville: | 1.4 |
| El Campo: | 13.6 |
 25.6% incidents where reported in the morning and 74.4% in the evening. The most fires (15.3%) took place on Saturday, and the least (13.4%) on Wednesday.
 Based on the 9,760 fires from years 2002 - 2018 most fires (9.9%) took place during January, and the least (6.7%) in November.
 Out of all 69,095 cases reported during the years 2002 - 2018, the most belonged to the categories: Rescue & EMS (59.5%), Fire (14.1%), and Hazardous Condition (9.9%).
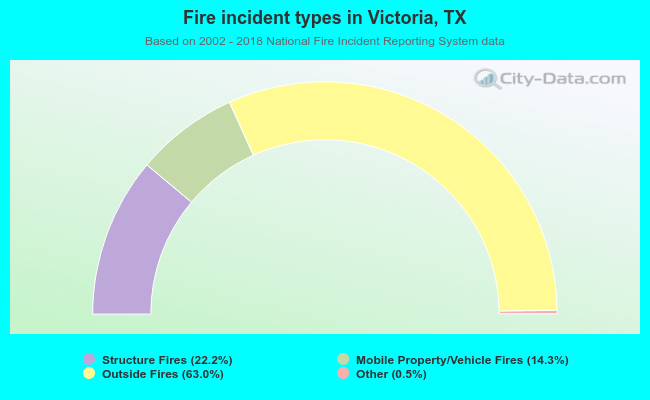 When looking into fire subcategories, the most incidents belonged to: Outside Fires (63.0%), and Structure Fires (22.2%).