Port Lavaca: Fire Incidents, Texas (TX)
Where are fire incidents reported in Port Lavaca, TX
Something went wrong! Please refresh the page.
|
| |||||||||||||||||||||||||||||||||||||||||||||||||||||||||||||||||||||||||||||||||||||||||||||||||||||||||||||
| Other | 235 | |||||||||||||||||||||||||||||||||||||||||||||||||||||||||||||||||||||||||||||||||||||||||||||||||||||||||||||
2002 - 2016 National Fire Incident Reporting System (NFIRS) incidents
- Incident types reported to NFIRS in Port Lavaca, TX
- 2,15755.5%Hazardous Condition
- 91123.4%Fire
- 3047.8%Service Call
- 2406.2%Rescue & EMS
- 1323.4%False Alarm
- 1263.2%Good Intent Call
- 110.3%Special Incident
- 40.1%Overpressure Rupture
- Fire incident types reported to NFIRS in Port Lavaca, TX
- 54259.5%Outside Fires
- 20122.1%Structure Fires
- 12613.8%Mobile Property/Vehicle Fires
- 424.6%Other
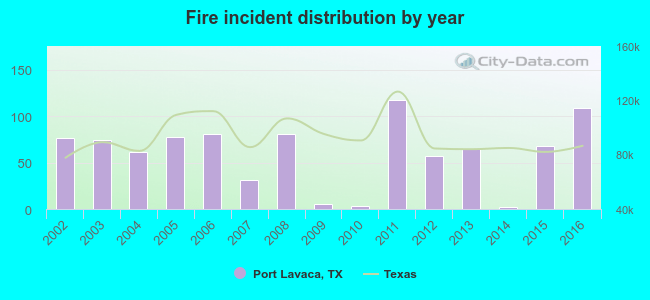 Based on the data from the years 2002 - 2016 the average number of fire incidents per year is 61. The highest number of reported fire incidents - 117 took place in 2011, and the least - 2 in 2014. The data has an increasing trend.
The average number of yearly fire incidents per 10k residents in Port Lavaca, TX compared to nearest cities:
(Note: Based on data for the last 3 years, including only cities with population 5,000 and above)
| Port Lavaca: | 44.8 |
| Edna: | 127.8 |
| Victoria: | 84.6 |
| El Campo: | 78.3 |
| Bay City: | 25.5 |
| Rockport: | 82.0 |
| Cuero: | 49.1 |
| Yoakum: | 110.2 |
| Wharton: | 32.3 |
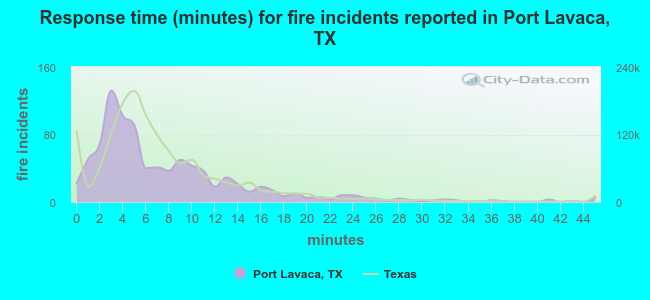 The median response time based on all reported fire incidents is 5 minutes. This is lower than the Texas median value.
The median response time in Port Lavaca, TX compared to nearest cities:
(Note: Based on data for all years, including only cities with at least 500 fire incidents)
| Port Lavaca: | 5 minutes |
| Bloomington: | 15 minutes |
| Edna: | 8 minutes |
| Victoria: | 9 minutes |
| Refugio: | 10 minutes |
| El Campo: | 5 minutes |
| Bay City: | 7 minutes |
| Rockport: | 7 minutes |
| Cuero: | 7 minutes |
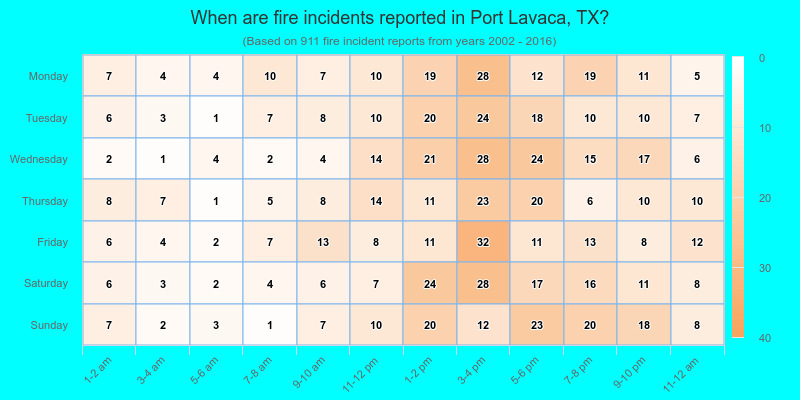
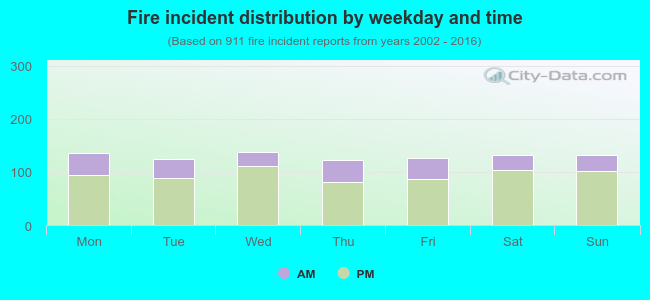 26.9% incidents where reported in the morning and 73.1% in the evening. The most fires (15.1%) took place on Wednesday, and the least (13.5%) on Thursday.
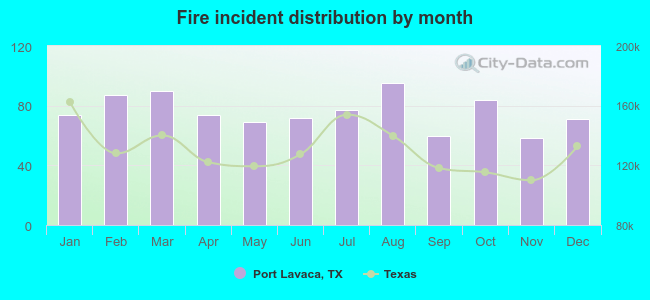 According to the 911 fires from years 2002 - 2016 most fires (10.4%) took place during August, and the least (6.4%) in November.
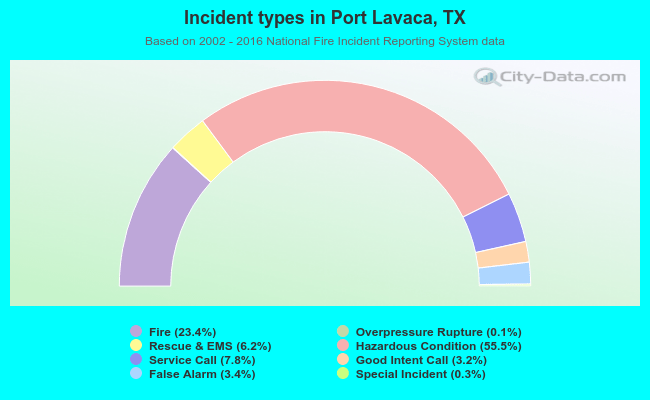 Out of all 3,885 cases reported during the years 2002 - 2016, the most belonged to the categories: Hazardous Condition (55.5%), Fire (23.4%), and Service Call (7.8%).
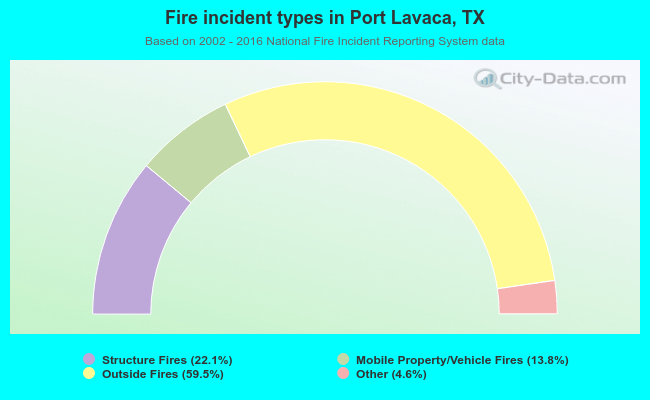 When looking into fire subcategories, the most reports belonged to: Outside Fires (59.5%), and Structure Fires (22.1%).