Vernon: Fire Incidents, Texas (TX)
Where are fire incidents reported in Vernon, TX
Something went wrong! Please refresh the page.
| Fire incidents reported | |
|---|---|
| Sreet name | Count |
| WILBARGER ST | 136 |
| HWY 287 W HWY | 130 |
| HWY 287 | 98 |
| HWY 287 E | 96 |
| TEXAS ST | 66 |
| CENTER DR | 60 |
| MAIN ST | 60 |
| COLLEGE DR | 54 |
| MAIDEN ST | 52 |
| SAND RD | 48 |
| HARRISON ST | 46 |
| FM 1763 RD | 44 |
| PEASE ST | 44 |
| WANDERER ST | 44 |
| YAMPARIKA ST | 42 |
| BOWIE ST | 40 |
| BREWER DR | 40 |
| PARADISE ST | 40 |
| WICHITA ST | 40 |
| HWY 283 | 38 |
| HWY 70 S | 38 |
| LEXINGTON ST | 38 |
| CUMBERLAND ST | 36 |
| HILLCREST DR | 36 |
| GORDON ST | 32 |
| HWY 283 N | 32 |
| MANSARD ST | 32 |
| MESQUITE ST | 32 |
| EAGLE ST | 28 |
| HOUSTON ST | 28 |
| Other | 742 |
2002 - 2018 National Fire Incident Reporting System (NFIRS) incidents
- Incident types reported to NFIRS in Vernon, TX
- 7,80260.9%Rescue & EMS
- 2,29217.9%Fire
- 1,32910.4%Hazardous Condition
- 6164.8%Service Call
- 5304.1%Good Intent Call
- 2071.6%False Alarm
- Fire incident types reported to NFIRS in Vernon, TX
- 1,44062.8%Outside Fires
- 51422.4%Structure Fires
- 29612.9%Mobile Property/Vehicle Fires
- 421.8%Other
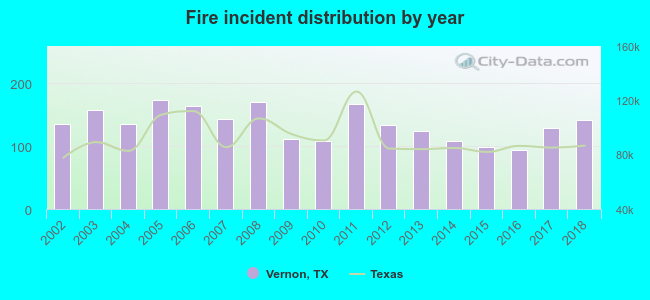 Based on the data from the years 2002 - 2018 the average number of fires per year is 135. The highest number of fire incidents - 173 took place in 2005, and the least - 94 in 2016. The data has an increasing trend.
The average number of yearly fire incidents per 10k residents in Vernon, TX compared to nearest cities:
(Note: Based on data for the last 3 years, including only cities with population 5,000 and above)
| Vernon: | 115.2 |
| Iowa Park: | 141.9 |
| Burkburnett: | 73.3 |
| Wichita Falls: | 49.7 |
| Childress: | 1.6 |
 The median response time based on all reported fire incidents is 7 minutes. This is close to the state median value.
The median response time in Vernon, TX compared to nearest cities:
(Note: Based on data for all years, including only cities with at least 500 fire incidents)
| Vernon: | 7 minutes |
| Quanah: | 6 minutes |
| Altus: | 4 minutes |
| Iowa Park: | 7 minutes |
| Burkburnett: | 6 minutes |
| Wichita Falls: | 4 minutes |
| Cache: | 10 minutes |
| Walters: | 9 minutes |
| Lawton: | 4 minutes |
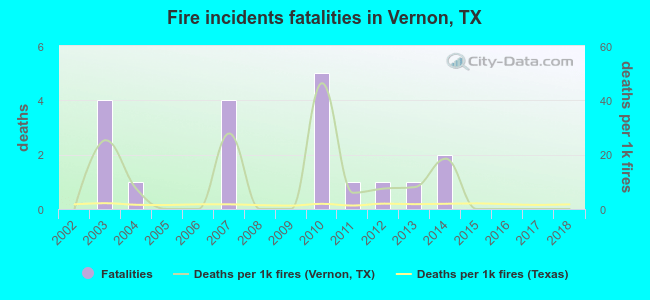 Based on the reports from the years 2002 - 2018 the average number of fire-related fatalities per year is 1. The highest number of deaths - 5 took place in 2010, and the lowest - 0 in 2002. The data has a constant trend.
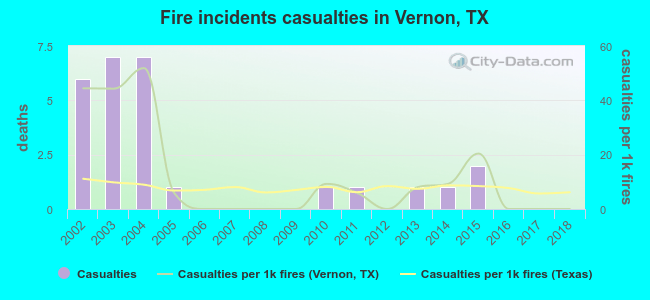 Based on the data from the years 2002 - 2018 the average number of fire-related yearly casualties is 2. The highest number of casualties - 7 took place in 2003, and the lowest - 0 in 2006. The data has a dropping trend.
The average number of injuries per 1,000 fire incidents is 12. This indicator was the highest - 52 in 2004, and the lowest 0 in 2006. The trend for injuries per 1,000 fires is dropping. Compared to the Texas value the number of injuries per 1,000 fires is higher.
Based on the data from the years 2002 - 2018 the average number of fire-related yearly casualties is 2. The highest number of casualties - 7 took place in 2003, and the lowest - 0 in 2006. The data has a dropping trend.
The average number of injuries per 1,000 fire incidents is 12. This indicator was the highest - 52 in 2004, and the lowest 0 in 2006. The trend for injuries per 1,000 fires is dropping. Compared to the Texas value the number of injuries per 1,000 fires is higher.Casualties per 1,000 incidents in Vernon, TX compared to nearest cities:
(Note: Based on data for all years, including only cities with at least 500 fire incidents)
| Vernon: | 11.8 |
| Quanah: | 0.0 |
| Altus: | 3.8 |
| Iowa Park: | 1.6 |
| Burkburnett: | 9.1 |
| Wichita Falls: | 10.7 |
| Cache: | 0.0 |
| Walters: | 0.0 |
| Lawton: | 5.8 |
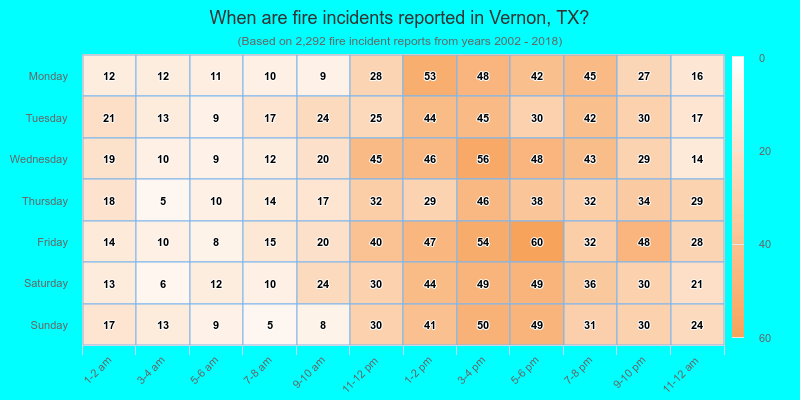
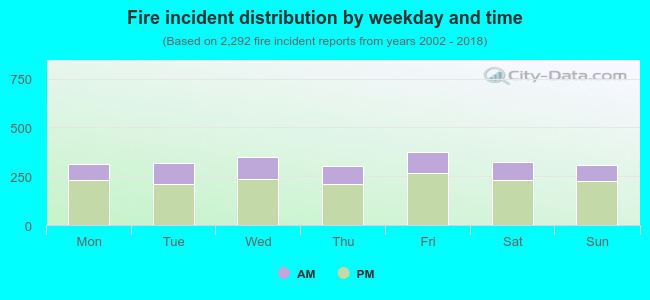 29.9% incidents where reported in the morning and 70.1% in the evening. The most fires (16.4%) took place on Friday, and the least (13.3%) on Thursday.
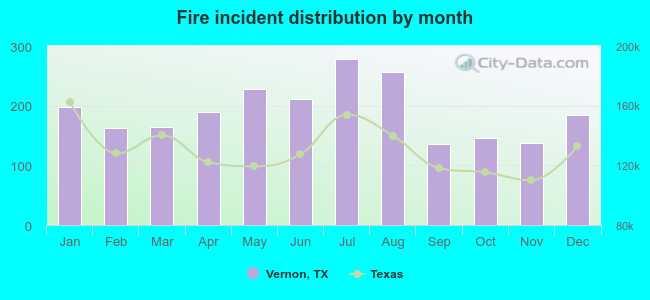 Based on the 2,292 reports from years 2002 - 2018 most fires (12.2%) took place during July, and the least (5.9%) in September.
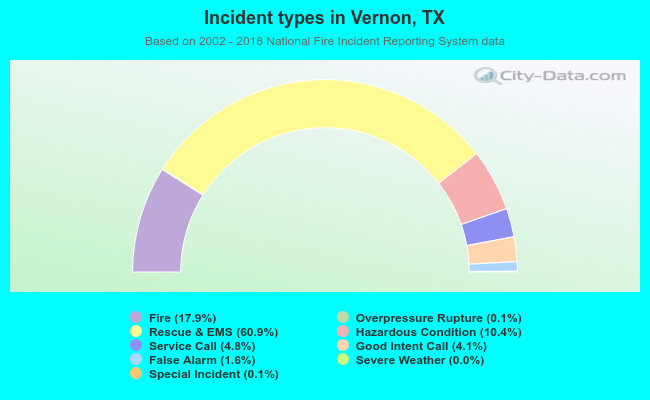 Out of all 12,801 cases reported during the years 2002 - 2018, the most belonged to the categories: Rescue & EMS (60.9%), Fire (17.9%), and Hazardous Condition (10.4%).
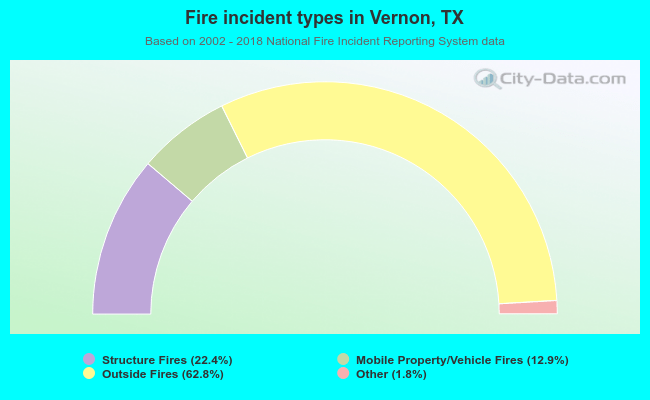 When looking into fire subcategories, the most incidents belonged to: Outside Fires (62.8%), and Structure Fires (22.4%).