Altus: Fire Incidents, Oklahoma (OK)
Where are fire incidents reported in Altus, OK
Something went wrong! Please refresh the page.
| Fire incidents reported | |
|---|---|
| Sreet name | Count |
| BROADWAY | 238 |
| MAIN | 206 |
| COURTHOUSE | 166 |
| PARK LANE | 90 |
| WILLARD | 84 |
| CARVER | 72 |
| LIVEOAK | 62 |
| HUDSON | 60 |
| NAVAJOE | 60 |
| LEE | 58 |
| RIDGECREST | 56 |
| WALNUT | 56 |
| SPRINGFIELD | 52 |
| COMMERCE | 50 |
| CRAIN | 48 |
| JACKSON | 48 |
| BLAIN | 46 |
| SUTHERLAND | 46 |
| PECAN | 44 |
| CYPRESS | 42 |
| DAVIS | 42 |
| FALCON RD | 42 |
| KATY | 42 |
| JULIAN | 40 |
| SPURGEON | 40 |
| FALCON | 38 |
| HARDY | 38 |
| BENSON | 36 |
| NONA | 36 |
| PARK LANE | 36 |
| Other | 373 |
2002 - 2018 National Fire Incident Reporting System (NFIRS) incidents
- Incident types reported to NFIRS in Altus, OK
- 2,59939.2%Hazardous Condition
- 2,34735.4%Fire
- 5428.2%Service Call
- 4116.2%Rescue & EMS
- 3895.9%Good Intent Call
- 3264.9%False Alarm
- 90.1%Overpressure Rupture
- Fire incident types reported to NFIRS in Altus, OK
- 1,41560.3%Outside Fires
- 67128.6%Structure Fires
- 2129.0%Mobile Property/Vehicle Fires
- 492.1%Other
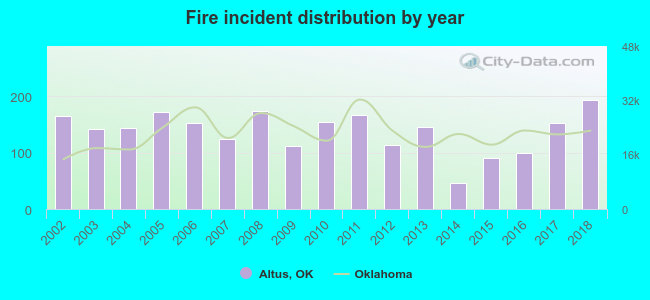 Based on the data from the years 2002 - 2018 the average number of fires per year is 138. The highest number of fires - 193 took place in 2018, and the least - 46 in 2014. The data has a growing trend.
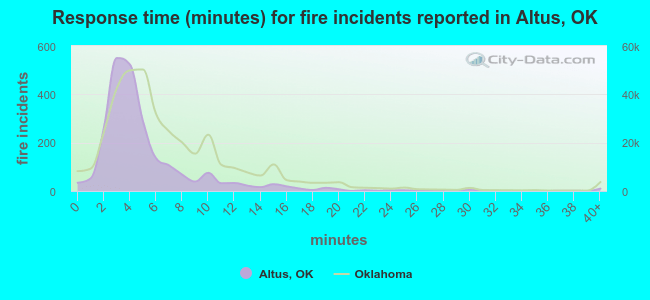 The median response time based on all reported fire incidents is 4 minutes. This is lower than the state median value.
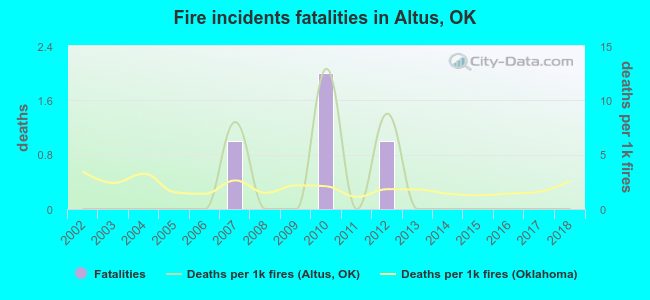 According to the reports from the years 2002 - 2018 the average number of fire-related fatalities per year is 0. The highest number of reported deaths - 2 took place in 2010, and the lowest - 0 in 2002. The data has a constant trend.
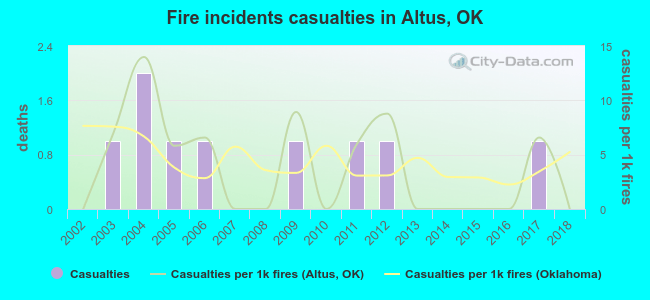 According to the data from the years 2002 - 2018 the average number of fire-related casualties per year is 1. The highest number of injuries - 2 took place in 2004, and the lowest - 0 in 2002. The data has a constant trend.
The average number of injuries per 1,000 fire incidents is 4. This indicator was the highest - 14 in 2004, and the lowest 0 in 2002. The trend for injuries per 1,000 incidents is constant. Compared to the state value the number of injuries per 1,000 fires is similar.
According to the data from the years 2002 - 2018 the average number of fire-related casualties per year is 1. The highest number of injuries - 2 took place in 2004, and the lowest - 0 in 2002. The data has a constant trend.
The average number of injuries per 1,000 fire incidents is 4. This indicator was the highest - 14 in 2004, and the lowest 0 in 2002. The trend for injuries per 1,000 incidents is constant. Compared to the state value the number of injuries per 1,000 fires is similar.
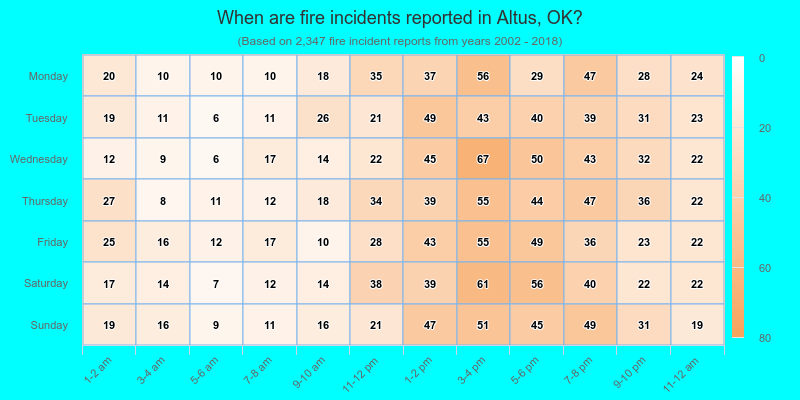
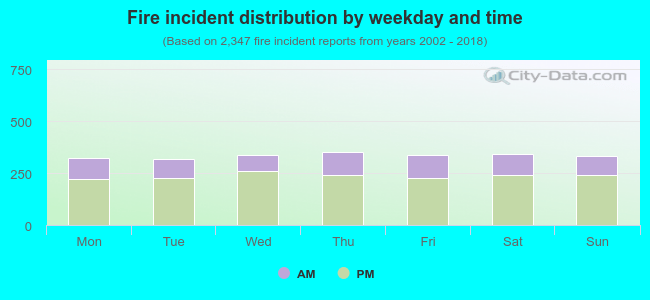 29.4% incidents where reported in the morning and 70.6% in the evening. The most fires (15.0%) took place on Thursday, and the least (13.6%) on Tuesday.
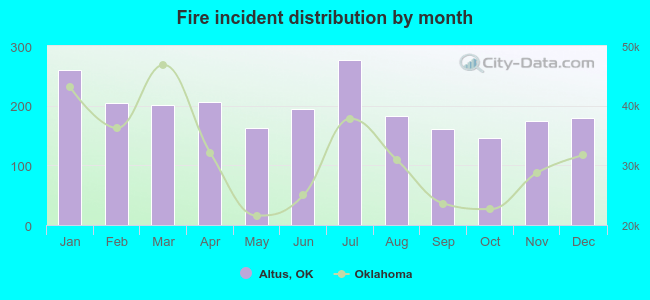 Based on the 2,347 incident reports from years 2002 - 2018 most fires (11.8%) took place during July, and the least (6.2%) in October.
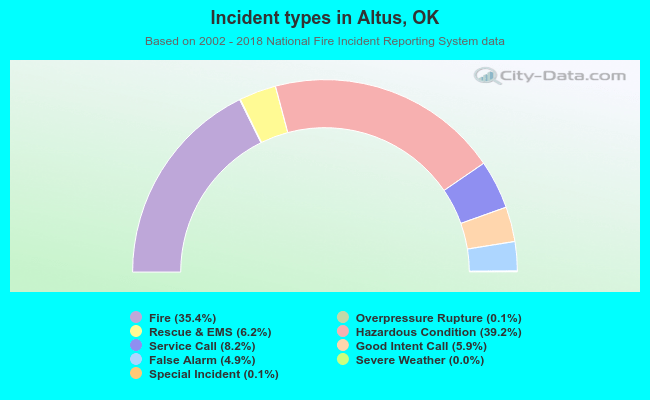 Out of all 6,632 cases reported during the years 2002 - 2018, the most belonged to the categories: Hazardous Condition (39.2%), Fire (35.4%), and Service Call (8.2%).
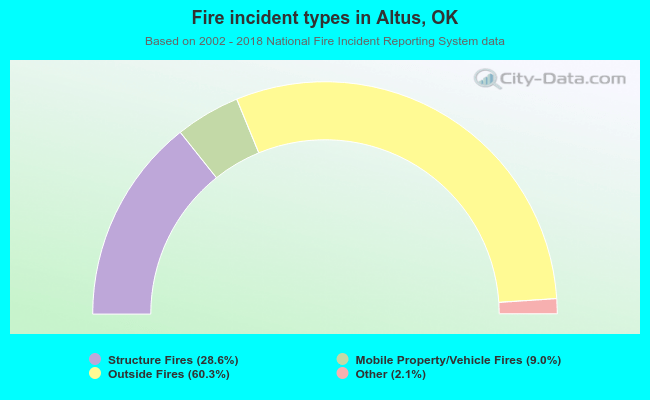 When looking into fire subcategories, the most reports belonged to: Outside Fires (60.3%), and Structure Fires (28.6%).