Vernal: Fire Incidents, Utah (UT)
Where are fire incidents reported in Vernal, UT
Something went wrong! Please refresh the page.
|
| |||||||||||||||||||||||||||||||||||||||||||||||||||||||||||||||||||||||||||||||||||||||||||||||||||||||||||||
| Other | 925 | |||||||||||||||||||||||||||||||||||||||||||||||||||||||||||||||||||||||||||||||||||||||||||||||||||||||||||||
2002 - 2018 National Fire Incident Reporting System (NFIRS) incidents
- Incident types reported to NFIRS in Vernal, UT
- 1,05149.0%Fire
- 39918.6%Hazardous Condition
- 29113.6%False Alarm
- 26812.5%Good Intent Call
- 632.9%Rescue & EMS
- 592.8%Service Call
- 100.5%Special Incident
- Fire incident types reported to NFIRS in Vernal, UT
- 51148.6%Outside Fires
- 35033.3%Structure Fires
- 16115.3%Mobile Property/Vehicle Fires
- 292.8%Other
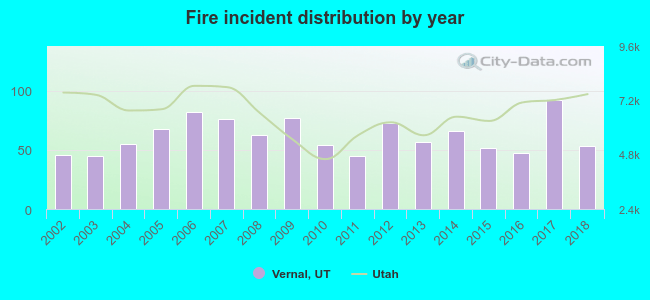 According to the data from the years 2002 - 2018 the average number of fire incidents per year is 62. The highest number of reported fire incidents - 92 took place in 2017, and the least - 45 in 2003. The data has a rising trend.
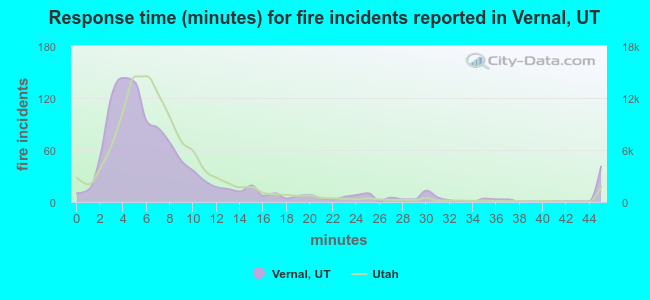 The median response time based on all reported fire incidents is 6 minutes. This is close to the state median value.
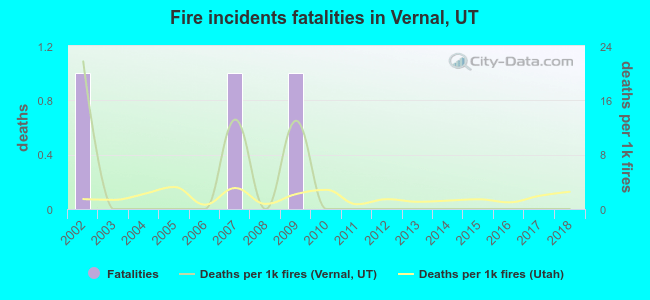 According to the reports from the years 2002 - 2018 the average number of fire-related fatalities per year is 0. The highest number of reported deaths - 1 took place in 2002, and the lowest - 0 in 2003. The data has a dropping trend.
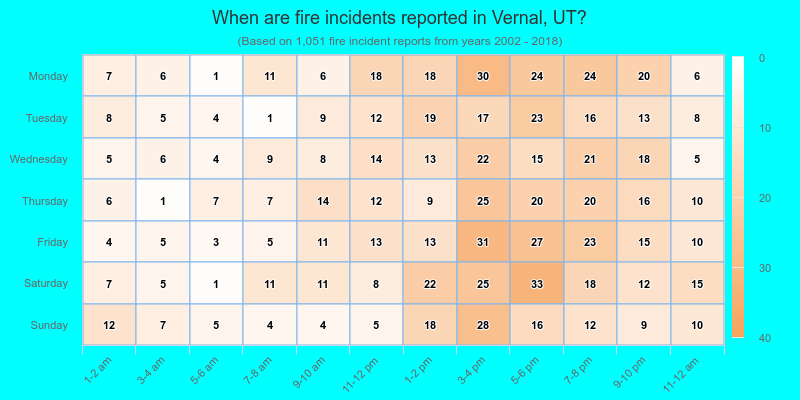
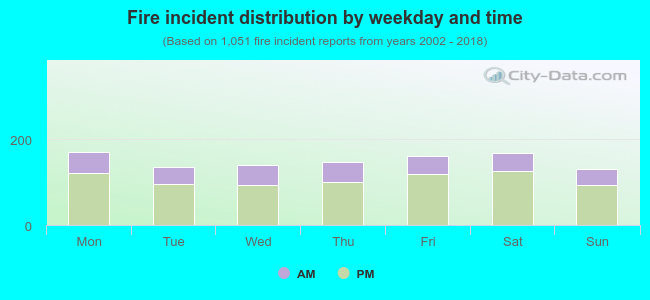 28.7% incidents where reported in the morning and 71.3% in the evening. The most fires (16.3%) took place on Monday, and the least (12.4%) on Sunday.
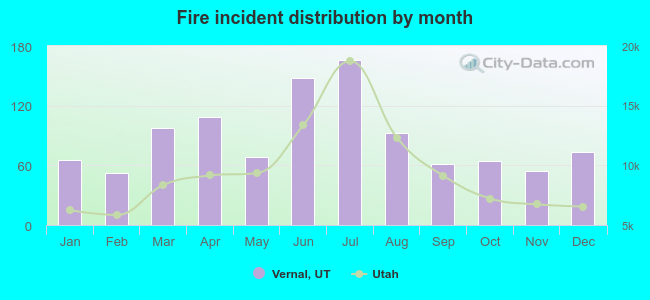 According to the 1,051 incident reports from years 2002 - 2018 most fires (15.8%) took place during July, and the least (4.9%) in February.
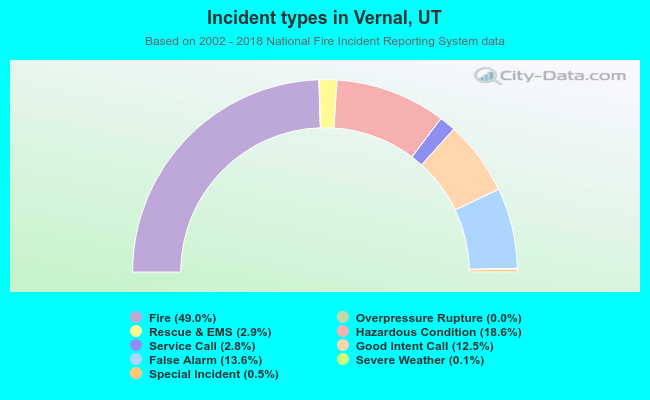 Out of all 2,144 cases reported during the years 2002 - 2018, the most belonged to the categories: Fire (49.0%), Hazardous Condition (18.6%), and False Alarm (13.6%).
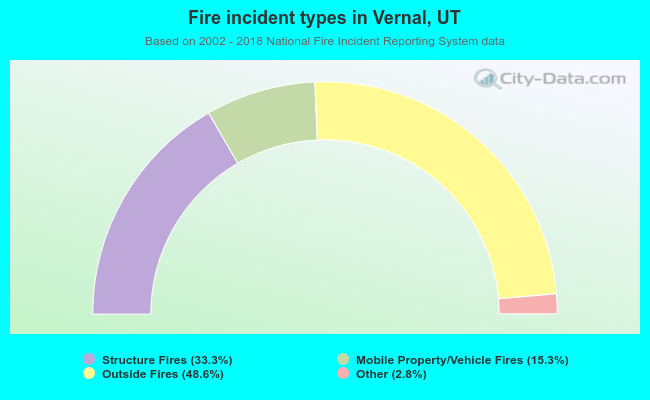 When looking into fire subcategories, the most reports belonged to: Outside Fires (48.6%), and Structure Fires (33.3%).