Heber: Fire Incidents, Utah (UT)
Where are fire incidents reported in Heber, UT
Something went wrong! Please refresh the page.
|
| |||||||||||||||||||||||||||||||||||||||||||||||||||||||||||||||||||||||||||||||||||||||||||||||||||||||||||||
| Other | 76 | |||||||||||||||||||||||||||||||||||||||||||||||||||||||||||||||||||||||||||||||||||||||||||||||||||||||||||||
2003 - 2018 National Fire Incident Reporting System (NFIRS) incidents
- Incident types reported to NFIRS in Heber, UT
- 1,81172.0%Rescue & EMS
- 2128.4%Fire
- 1586.3%False Alarm
- 1506.0%Hazardous Condition
- 1224.8%Good Intent Call
- 622.5%Service Call
- Fire incident types reported to NFIRS in Heber, UT
- 9343.9%Outside Fires
- 6128.8%Structure Fires
- 4521.2%Mobile Property/Vehicle Fires
- 136.1%Other
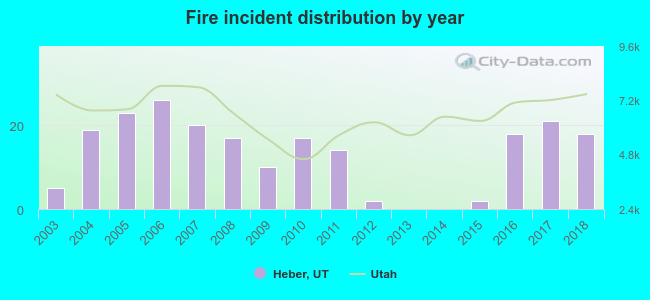 According to the data from the years 2003 - 2018 the average number of fire incidents per year is 13. The highest number of reported fires - 26 took place in 2006, and the least - 0 in 2013. The data has a growing trend.
The average number of yearly fire incidents per 10k residents in Heber, UT compared to nearest cities:
(Note: Based on data for the last 3 years, including only cities with population 5,000 and above)
| Heber: | 14.0 |
| Park City: | 66.6 |
| Pleasant Grove: | 12.9 |
| Alpine: | 8.2 |
| Cedar Hills: | 5.8 |
| Lindon: | 20.8 |
| Orem: | 14.5 |
| Highland: | 7.4 |
| American Fork: | 16.9 |
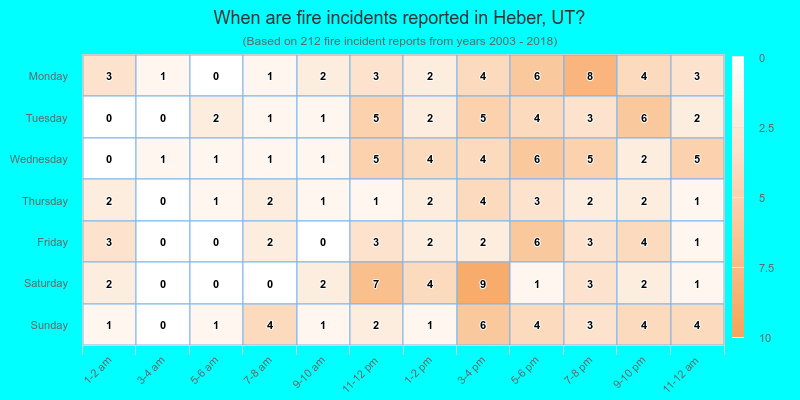
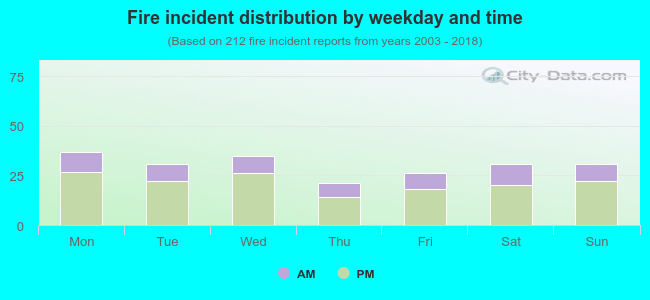 29.7% incidents where reported in the morning and 70.3% in the evening. The most fires (17.5%) took place on Monday, and the least (9.9%) on Thursday.
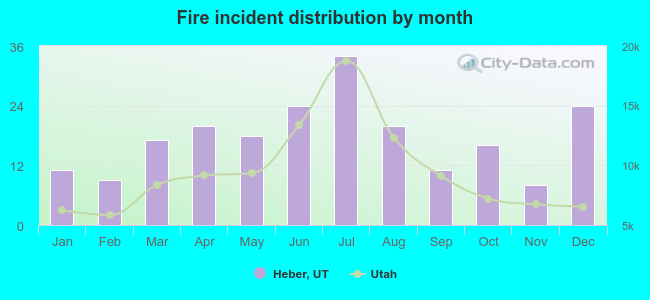 According to the 212 fire incidents from years 2003 - 2018 most fires (16.0%) took place during July, and the least (3.8%) in November.
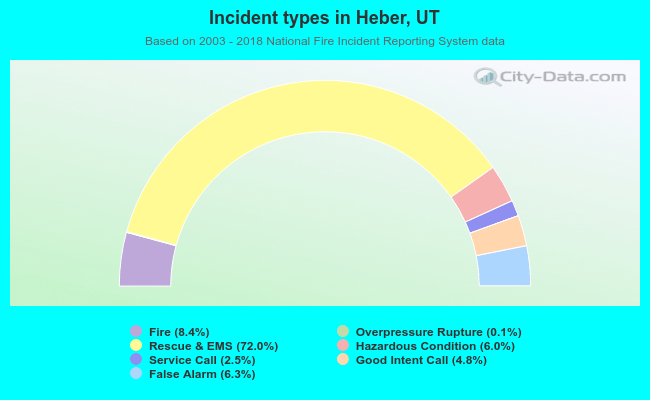 Out of all 2,517 cases reported during the years 2003 - 2018, the most belonged to the categories: Rescue & EMS (72.0%), Fire (8.4%), and False Alarm (6.3%).
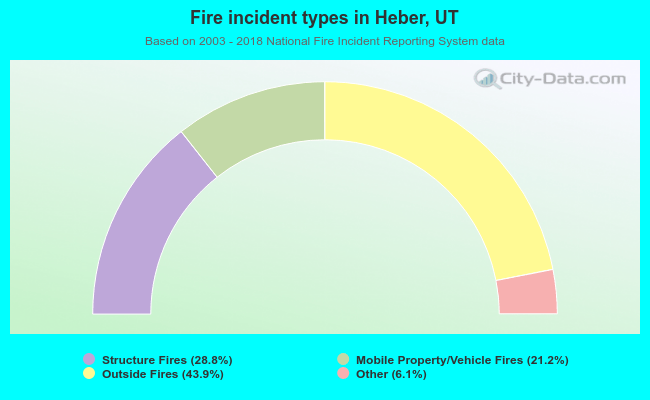 When looking into fire subcategories, the most incidents belonged to: Outside Fires (43.9%), and Structure Fires (28.8%).