Upper Marlboro: Fire Incidents, Maryland (MD)
Where are fire incidents reported in Upper Marlboro, MD
Something went wrong! Please refresh the page.
|
| |||||||||||||||||||||||||||||||||||||||||||||||||||||||||||||||||||||||||||||||||||||||||||||||||||||||||||||
| Other | 85 | |||||||||||||||||||||||||||||||||||||||||||||||||||||||||||||||||||||||||||||||||||||||||||||||||||||||||||||
2003 - 2018 National Fire Incident Reporting System (NFIRS) incidents
- Incident types reported to NFIRS in Upper Marlboro, MD
- 8,74177.7%Rescue & EMS
- 6415.7%Fire
- 5885.2%False Alarm
- 4914.4%Hazardous Condition
- 3943.5%Good Intent Call
- 3743.3%Service Call
- 130.1%Special Incident
- Fire incident types reported to NFIRS in Upper Marlboro, MD
- 27342.6%Structure Fires
- 15023.4%Mobile Property/Vehicle Fires
- 12719.8%Outside Fires
- 9114.2%Other
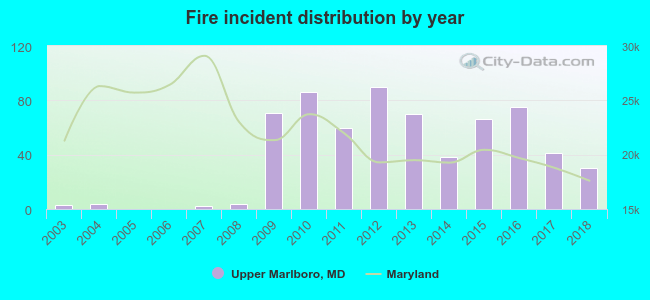 Based on the data from the years 2003 - 2018 the average number of fires per year is 40. The highest number of reported fire incidents - 90 took place in 2012, and the least - 0 in 2005. The data has a growing trend.
 The median response time based on all reported fire incidents is 9 minutes. This is higher than the Maryland median value.
The median response time in Upper Marlboro, MD compared to nearest cities:
(Note: Based on data for all years, including only cities with at least 500 fire incidents)
| Upper Marlboro: | 9 minutes |
| Largo: | 7 minutes |
| Dunkirk: | 7 minutes |
| Clinton: | 7 minutes |
| Suitland: | 6 minutes |
| Brandywine: | 10 minutes |
| Bowie: | 7 minutes |
| Landover: | 5 minutes |
| Lanham: | 7 minutes |
 33.2% incidents where reported in the morning and 66.8% in the evening. The most fires (16.4%) took place on Wednesday, and the least (12.5%) on Friday.
 According to the 641 reports from years 2003 - 2018 most fires (12.0%) took place during July, and the least (5.0%) in May.
 Out of all 11,246 cases reported during the years 2003 - 2018, the most belonged to the categories: Rescue & EMS (77.7%), Fire (5.7%), and False Alarm (5.2%).
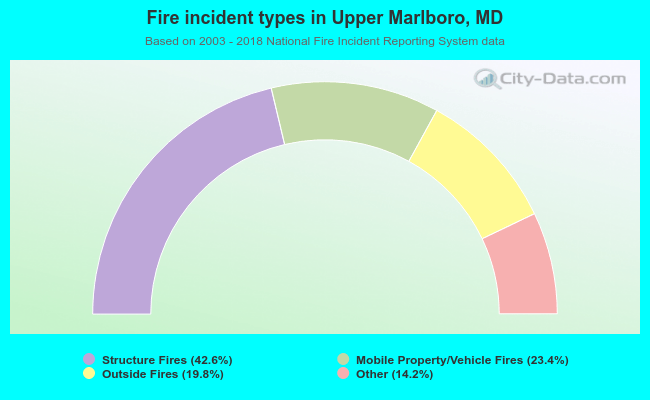 When looking into fire subcategories, the most reports belonged to: Structure Fires (42.6%), and Mobile Property/Vehicle Fires (23.4%).