Largo: Fire Incidents, Maryland (MD)
Where are fire incidents reported in Largo, MD
Something went wrong! Please refresh the page.
|
| |||||||||||||||||||||||||||||||||||||||||||||||||||||||||||||||||||||||||||||||||||||||||||||||||||||||||||||
2009 - 2015 National Fire Incident Reporting System (NFIRS) incidents
- Incident types reported to NFIRS in Largo, MD
- 65646.2%Fire
- 40428.5%Hazardous Condition
- 1208.5%Rescue & EMS
- 1198.4%False Alarm
- 654.6%Service Call
- 543.8%Good Intent Call
- Fire incident types reported to NFIRS in Largo, MD
- 30446.3%Structure Fires
- 13320.3%Mobile Property/Vehicle Fires
- 13120.0%Other
- 8813.4%Outside Fires
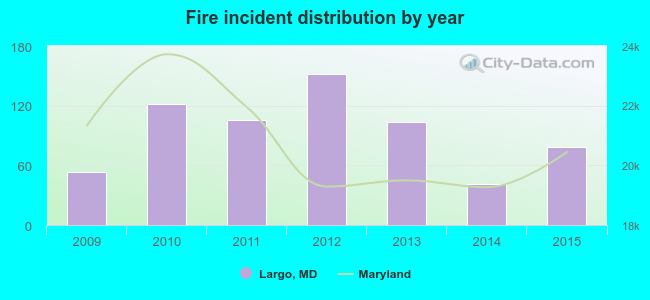 Based on the data from the years 2009 - 2015 the average number of fire incidents per year is 94. The highest number of reported fires - 152 took place in 2012, and the least - 41 in 2014. The data has a rising trend.
 The median response time based on all reported fire incidents is 7 minutes. This is similar to the Maryland median value.
The median response time in Largo, MD compared to nearest cities:
(Note: Based on data for all years, including only cities with at least 500 fire incidents)
| Largo: | 7 minutes |
| Landover: | 5 minutes |
| Suitland: | 6 minutes |
| Upper Marlboro: | 9 minutes |
| Lanham: | 7 minutes |
| Bladensburg: | 5 minutes |
| Bowie: | 7 minutes |
| Hyattsville: | 5 minutes |
| Clinton: | 7 minutes |
 32.5% incidents where reported in the morning and 67.5% in the evening. The most fires (18.8%) took place on Thursday, and the least (12.0%) on Wednesday.
 According to the 656 fire incidents from years 2009 - 2015 most fires (12.3%) took place during April, and the least (3.8%) in November.
 Out of all 1,420 cases reported during the years 2009 - 2015, the most belonged to the categories: Fire (46.2%), Rescue & EMS (28.5%), and Overpressure Rupture (8.5%).
 When looking into fire subcategories, the most incidents belonged to: Structure Fires (46.3%), and Mobile Property/Vehicle Fires (20.3%).