Union City: Fire Incidents, New Jersey (NJ)
Where are fire incidents reported in Union City, NJ
Something went wrong! Please refresh the page.
| Fire incidents reported | |
|---|---|
| Sreet name | Count |
| BERGENLINE AVENUE | 542 |
| BERGENLINE AVE | 344 |
| KENNEDY BLVD | 258 |
| PALISADE AVENUE | 218 |
| CENTRAL AVENUE | 172 |
| NEW YORK AVENUE | 154 |
| NEW YORK AVE | 152 |
| PALISADE AVE | 144 |
| SUMMIT AVENUE | 144 |
| CENTRAL AVE | 124 |
| SUMMIT AVE | 118 |
| 22ND ST | 74 |
| 39TH STREET | 64 |
| WEST STREET | 64 |
| MANHATTAN AVENUE | 62 |
| 22ND STREET | 58 |
| PARK AVENUE | 54 |
| 27TH ST | 50 |
| VIADUCT | 50 |
| 48TH STREET | 48 |
| MANHATTAN AVE | 48 |
| 19TH STREET | 46 |
| 39TH ST | 46 |
| 7TH STREET | 42 |
| 43RD ST | 40 |
| 11TH STREET | 38 |
| 38TH ST | 38 |
| BROADWAY | 38 |
| 10TH ST | 36 |
| 11TH ST | 36 |
2004 - 2018 National Fire Incident Reporting System (NFIRS) incidents
- Incident types reported to NFIRS in Union City, NJ
- 5,17232.8%Hazardous Condition
- 4,39327.8%False Alarm
- 2,67517.0%Fire
- 1,87711.9%Service Call
- 9025.7%Good Intent Call
- 7044.5%Rescue & EMS
- 270.2%Special Incident
- 230.1%Overpressure Rupture
- Fire incident types reported to NFIRS in Union City, NJ
- 2,08978.1%Structure Fires
- 35113.1%Outside Fires
- 1776.6%Mobile Property/Vehicle Fires
- 582.2%Other
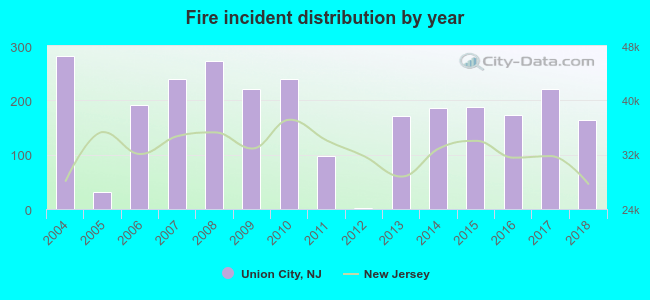 Based on the data from the years 2004 - 2018 the average number of fire incidents per year is 178. The highest number of reported fire incidents - 281 took place in 2004, and the least - 2 in 2012. The data has a decreasing trend.
The average number of yearly fire incidents per 10k residents in Union City, NJ compared to nearest cities:
(Note: Based on data for the last 3 years, including only cities with population 5,000 and above)
| Union City: | 27.0 |
| Hoboken: | 42.3 |
| West New York: | 20.0 |
| Secaucus: | 39.3 |
| Guttenberg: | 20.6 |
| Jersey City: | 54.2 |
| Fairview: | 16.3 |
| Cliffside Park: | 53.6 |
| Ridgefield: | 38.7 |
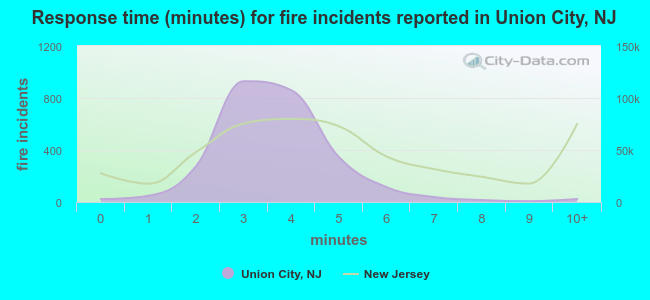 The median response time based on all reported fire incidents is 4 minutes. This is lower compared to the state median value.
The median response time in Union City, NJ compared to nearest cities:
(Note: Based on data for all years, including only cities with at least 500 fire incidents)
| Union City: | 4 minutes |
| Hoboken: | 3 minutes |
| West New York: | 4 minutes |
| Secaucus: | 4 minutes |
| Jersey City: | 4 minutes |
| Cliffside Park: | 5 minutes |
| Ridgefield: | 3 minutes |
| Edgewater: | 3 minutes |
| Lyndhurst: | 3 minutes |
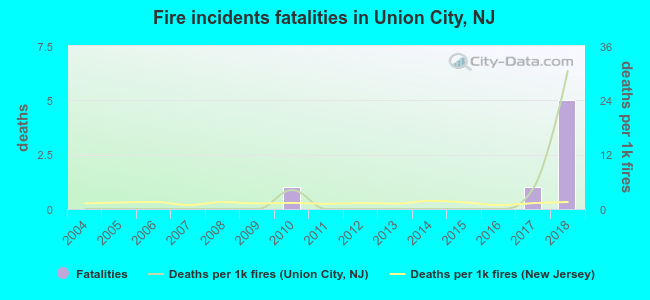 Based on the reports from the years 2004 - 2018 the average number of fire-related fatalities per year is 0. The highest number of deaths - 5 took place in 2018, and the lowest - 0 in 2004. The data has a rising trend.
The average number of fatalities per 1,000 fires is 3. This indicator was the highest - 30 in 2018, and the lowest 0 in 2004. The trend for deaths per 1,000 fire incidents is rising. Compared to the state value the number of deaths per 1,000 incidents is higher.
Based on the reports from the years 2004 - 2018 the average number of fire-related fatalities per year is 0. The highest number of deaths - 5 took place in 2018, and the lowest - 0 in 2004. The data has a rising trend.
The average number of fatalities per 1,000 fires is 3. This indicator was the highest - 30 in 2018, and the lowest 0 in 2004. The trend for deaths per 1,000 fire incidents is rising. Compared to the state value the number of deaths per 1,000 incidents is higher.Deaths per 1,000 incidents in Union City, NJ compared to nearest cities:
(Note: Based on data for all years, including only cities with at least 2,500 fire incidents)
| Union City: | 2.6 |
| Hoboken: | 0.7 |
| Jersey City: | 0.9 |
| Passaic: | 0.3 |
| Newark: | 1.3 |
| Teaneck: | 3.5 |
| Englewood: | 1.1 |
| East Orange: | 3.9 |
| Irvington: | 2.9 |
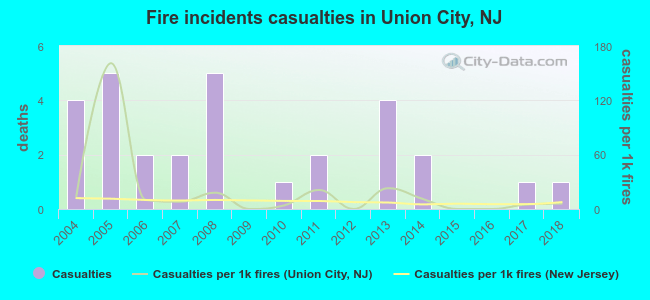 According to the reports from the years 2004 - 2018 the average number of fire-related yearly casualties is 2. The highest number of reported casualties - 5 took place in 2005, and the lowest - 0 in 2009. The data has a decreasing trend.
The average number of injuries per 1,000 fires is 19. This indicator was the highest - 161 in 2005, and the lowest 0 in 2009. The trend for casualties per 1,000 fire incidents is declining. Compared to the state value the number of casualties per 1,000 incidents is higher.
According to the reports from the years 2004 - 2018 the average number of fire-related yearly casualties is 2. The highest number of reported casualties - 5 took place in 2005, and the lowest - 0 in 2009. The data has a decreasing trend.
The average number of injuries per 1,000 fires is 19. This indicator was the highest - 161 in 2005, and the lowest 0 in 2009. The trend for casualties per 1,000 fire incidents is declining. Compared to the state value the number of casualties per 1,000 incidents is higher.Casualties per 1,000 incidents in Union City, NJ compared to nearest cities:
(Note: Based on data for all years, including only cities with at least 500 fire incidents)
| Union City: | 10.8 |
| Hoboken: | 4.4 |
| West New York: | 3.4 |
| Secaucus: | 5.0 |
| Jersey City: | 8.9 |
| Cliffside Park: | 4.7 |
| Ridgefield: | 7.6 |
| Edgewater: | 0.0 |
| Lyndhurst: | 6.0 |
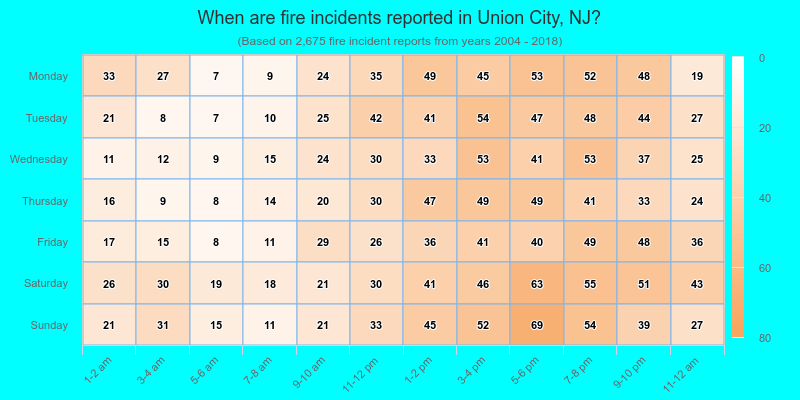
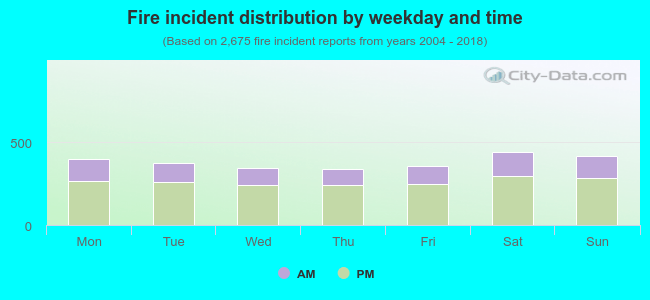 31.0% incidents where reported in the morning and 69.0% in the evening. The most fires (16.6%) took place on Saturday, and the least (12.7%) on Thursday.
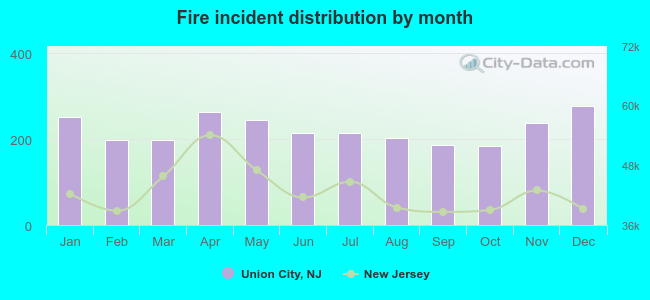 Based on the 2,675 fire incident reports from years 2004 - 2018 most fires (10.4%) took place during December, and the least (6.9%) in October.
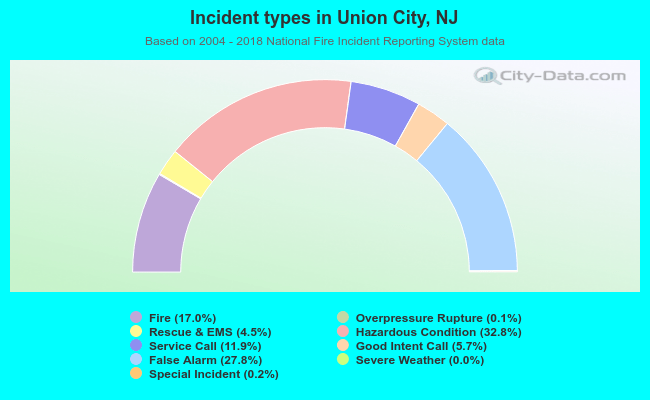 Out of all 15,778 cases reported during the years 2004 - 2018, the most belonged to the categories: Hazardous Condition (32.8%), False Alarm (27.8%), and Fire (17.0%).
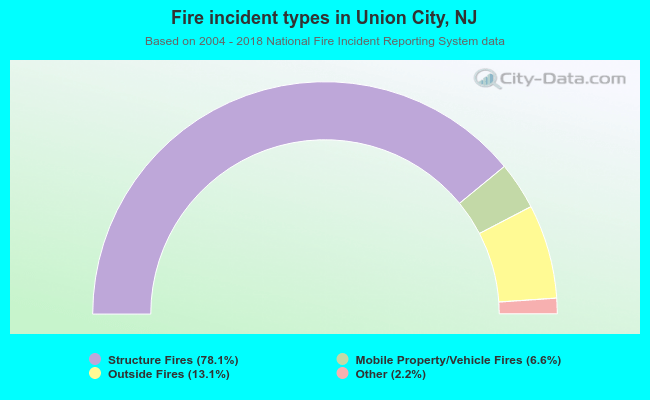 When looking into fire subcategories, the most reports belonged to: Structure Fires (78.1%), and Outside Fires (13.1%).