East Orange: Fire Incidents, New Jersey (NJ)
Where are fire incidents reported in East Orange, NJ
Something went wrong! Please refresh the page.
| Fire incidents reported | |
|---|---|
| Sreet name | Count |
| S MUNN AVE | 414 |
| S HARRISON ST | 328 |
| PROSPECT ST | 294 |
| PARK AVE | 200 |
| CENTRAL AVE | 180 |
| N ARLINGTON AVE | 174 |
| MAIN ST | 158 |
| GLENWOOD AVE | 132 |
| MAIN ST | 132 |
| MUNN AVE | 108 |
| N WALNUT ST | 106 |
| PROSPECT ST | 104 |
| N GROVE ST | 100 |
| ARLINGTON AVE | 90 |
| WILLIAM ST | 90 |
| HALSTED ST | 78 |
| HARRISON ST | 76 |
| S ARLINGTON AVE | 76 |
| S CLINTON ST | 76 |
| PARK AVE | 74 |
| WALNUT ST | 74 |
| S BURNET ST | 70 |
| AMHERST ST | 66 |
| SPRINGDALE AVE | 66 |
| 4TH AVE | 62 |
| S GROVE ST | 60 |
| CHESTNUT ST | 56 |
| N MAPLE AVE | 56 |
| WASHINGTON ST | 52 |
| LENOX AVE | 48 |
2008 - 2018 National Fire Incident Reporting System (NFIRS) incidents
- Incident types reported to NFIRS in East Orange, NJ
- 4,11422.3%Hazardous Condition
- 3,92721.3%False Alarm
- 3,58519.5%Service Call
- 3,30017.9%Fire
- 1,87410.2%Rescue & EMS
- 1,3927.6%Good Intent Call
- 760.4%Overpressure Rupture
- 750.4%Severe Weather
- 660.4%Special Incident
- Fire incident types reported to NFIRS in East Orange, NJ
- 2,55077.3%Structure Fires
- 45713.8%Outside Fires
- 2256.8%Mobile Property/Vehicle Fires
- 682.1%Other
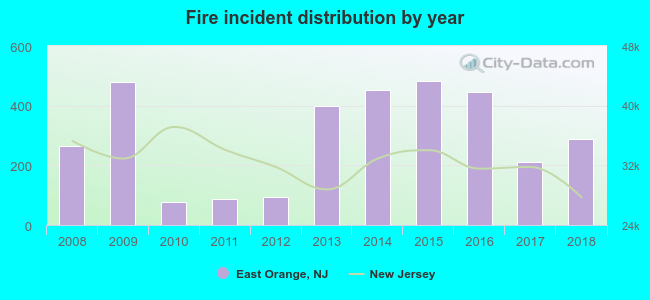 According to the data from the years 2008 - 2018 the average number of fire incidents per year is 298. The highest number of fires - 482 took place in 2015, and the least - 76 in 2010. The data has a growing trend.
The average number of yearly fire incidents per 10k residents in East Orange, NJ compared to nearest cities:
(Note: Based on data for the last 3 years, including only cities with population 5,000 and above)
| East Orange: | 48.4 |
| Orange: | 24.7 |
| Newark: | 41.2 |
| Glen Ridge: | 15.6 |
| West Orange: | 32.6 |
| South Orange: | 24.3 |
| Bloomfield: | 31.3 |
| Irvington: | 26.2 |
| Belleville: | 25.0 |
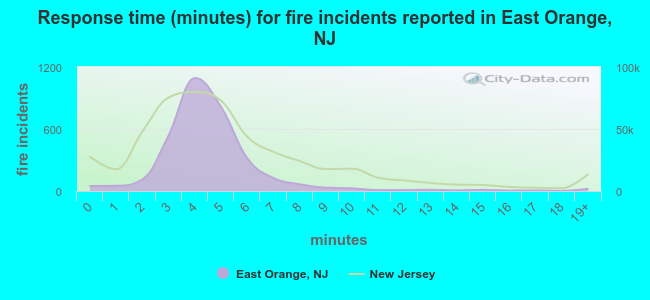 The median response time based on all reported fire incidents is 4 minutes. This is lower compared to the New Jersey median value.
The median response time in East Orange, NJ compared to nearest cities:
(Note: Based on data for all years, including only cities with at least 500 fire incidents)
| East Orange: | 4 minutes |
| Orange: | 3 minutes |
| Newark: | 3 minutes |
| West Orange: | 5 minutes |
| South Orange: | 3 minutes |
| Bloomfield: | 2 minutes |
| Irvington: | 3 minutes |
| Belleville: | 3 minutes |
| Harrison: | 2 minutes |
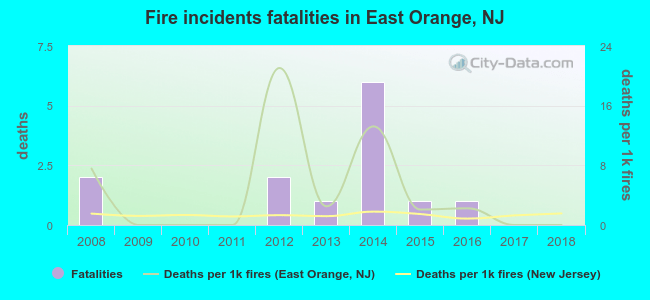 According to the data from the years 2008 - 2018 the average number of fire-related yearly deaths is 1. The highest number of reported deaths - 6 took place in 2014, and the lowest - 0 in 2009. The data has a declining trend.
The average number of deaths per 1,000 fires is 4. This indicator was the highest - 21 in 2012, and the lowest 0 in 2009. The trend for fatalities per 1,000 fires is dropping. Compared to the state value the number of deaths per 1,000 incidents is much higher.
According to the data from the years 2008 - 2018 the average number of fire-related yearly deaths is 1. The highest number of reported deaths - 6 took place in 2014, and the lowest - 0 in 2009. The data has a declining trend.
The average number of deaths per 1,000 fires is 4. This indicator was the highest - 21 in 2012, and the lowest 0 in 2009. The trend for fatalities per 1,000 fires is dropping. Compared to the state value the number of deaths per 1,000 incidents is much higher.Deaths per 1,000 incidents in East Orange, NJ compared to nearest cities:
(Note: Based on data for all years, including only cities with at least 2,500 fire incidents)
| East Orange: | 3.9 |
| Newark: | 1.3 |
| Irvington: | 2.9 |
| Union: | 2.7 |
| Elizabeth: | 1.3 |
| Passaic: | 0.3 |
| Jersey City: | 0.9 |
| Union City: | 2.6 |
| Hoboken: | 0.7 |
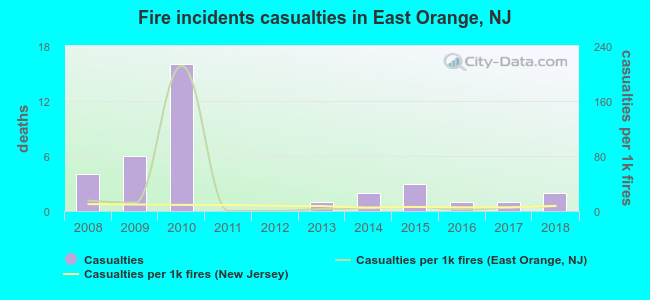 Based on the reports from the years 2008 - 2018 the average number of fire-related yearly casualties is 3. The highest number of reported casualties - 16 took place in 2010, and the lowest - 0 in 2011. The data has a dropping trend.
The average number of casualties per 1,000 fire incidents is 24. This indicator was the highest - 211 in 2010, and the lowest 0 in 2011. The trend for injuries per 1,000 fires is dropping. Compared to the state value the number of casualties per 1,000 fire incidents is higher.
Based on the reports from the years 2008 - 2018 the average number of fire-related yearly casualties is 3. The highest number of reported casualties - 16 took place in 2010, and the lowest - 0 in 2011. The data has a dropping trend.
The average number of casualties per 1,000 fire incidents is 24. This indicator was the highest - 211 in 2010, and the lowest 0 in 2011. The trend for injuries per 1,000 fires is dropping. Compared to the state value the number of casualties per 1,000 fire incidents is higher.Casualties per 1,000 incidents in East Orange, NJ compared to nearest cities:
(Note: Based on data for all years, including only cities with at least 500 fire incidents)
| East Orange: | 10.9 |
| Orange: | 6.0 |
| Newark: | 5.7 |
| West Orange: | 10.1 |
| South Orange: | 8.9 |
| Bloomfield: | 9.9 |
| Irvington: | 15.3 |
| Belleville: | 10.2 |
| Harrison: | 8.3 |
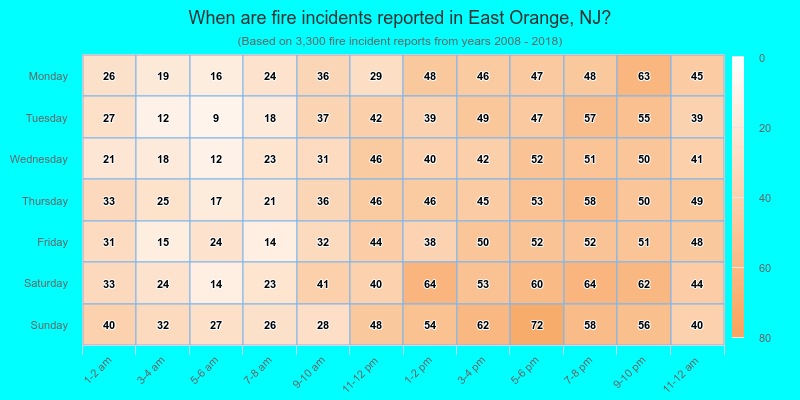
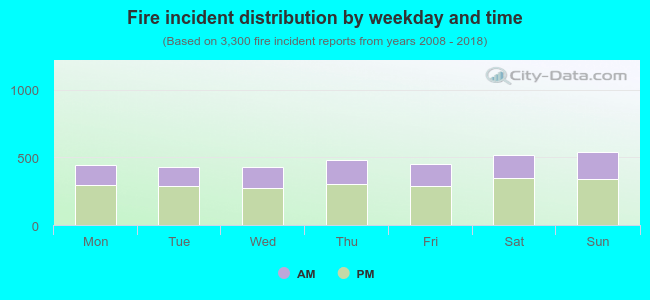 35.2% incidents where reported in the morning and 64.8% in the evening. The most fires (16.5%) took place on Sunday, and the least (12.9%) on Wednesday.
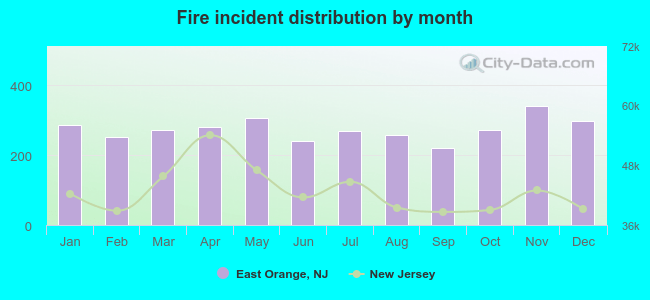 According to the 3,300 incident reports from years 2008 - 2018 most fires (10.4%) took place during November, and the least (6.7%) in September.
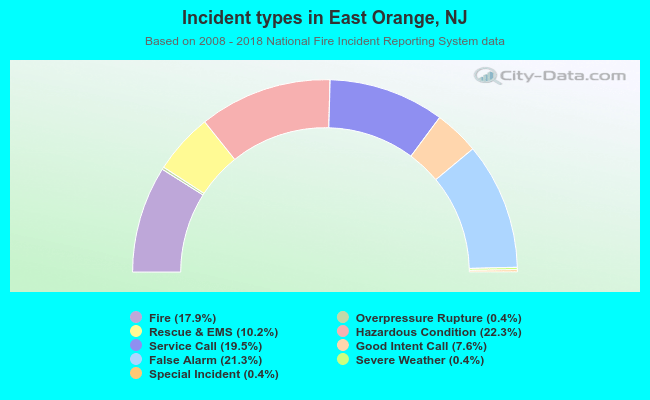 Out of all 18,409 cases reported during the years 2008 - 2018, the most belonged to the categories: Hazardous Condition (22.3%), False Alarm (21.3%), and Service Call (19.5%).
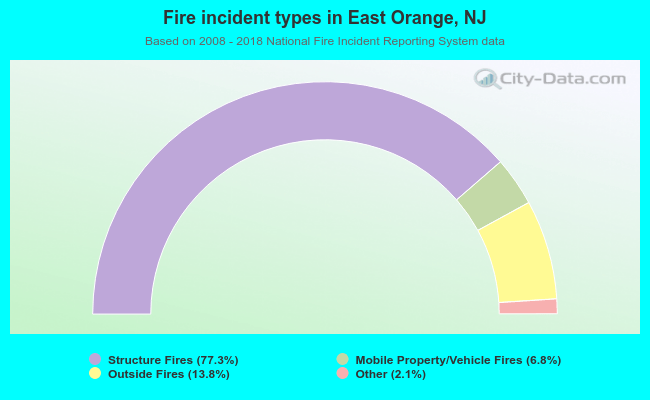 When looking into fire subcategories, the most reports belonged to: Structure Fires (77.3%), and Outside Fires (13.8%).