| Fire incidents reported |
|---|
| Sreet name | Count |
|---|
| REDMAN ROAD | 124 | | BROCKPORT SPENCERPORT ROAD | 44 | | FOURTH SECTION ROAD | 36 | | LAKE ROAD | 24 | | LAKE ROAD SOUTH | 24 | | REDMAN RD | 24 | | FOURTH SECTION RD | 20 | | LAKE RD | 20 | | BEADLE ROAD | 16 | | OWENS ROAD | 16 | | VIKING WAY | 16 | | BROCKPORT SPENCERPRT RD | 14 | | WOODLANDS WAY | 14 | | GALLUP ROAD | 12 | | HOLLYBROOK ROAD | 12 | | SWEDEN HILL ROAD | 12 | | SWEDEN WALKER ROAD | 12 | | WEST CANAL ROAD | 12 | | CAPEN ROAD | 8 | | CENTRAL SCHOOL DRIVE | 8 | | EAST AVENUE | 8 | | REED ROAD | 8 | | WHITE ROAD | 8 | | BEADLE RD | 6 | | HOLLEY STREET | 6 |
| | | Fire incidents reported |
|---|
| Sreet name | Count |
|---|
| LIFETIME WY | 6 | | SALMON CREEK RD | 6 | | SALMON CREEK ROAD | 6 | | SHUMWAY ROAD | 6 | | SWEDEN WALKER RD | 6 | | TOWNHOME TERRACE | 6 | | COLBY STREET | 4 | | E CANAL RD | 4 | | EAST CANAL ROAD | 4 | | EULER ROAD | 4 | | GORDON RD | 4 | | KEYSTONE COURT | 4 | | LADUE RD | 4 | | LADUE ROAD | 4 | | NATHANIEL POOLE TRAIL | 4 | | OGEE TRAIL | 4 | | ROOT RD | 4 | | SWAMP ROAD | 4 | | TALAMORA TRAIL | 4 | | TIMBER TRAIL | 4 | | TRANSIT WY | 4 | | BROCKPORT SPENC RD SWEDEN WA | 2 | | CAMPBELL ROAD | 2 | | CAPEN RD | 2 | | DURYEA DRIVE | 2 |
|
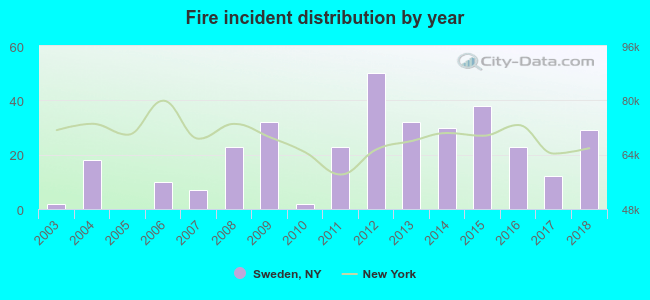 Based on the data from the years 2003 - 2018 the average number of fires per year is 21. The highest number of fire incidents - 50 took place in 2012, and the least - 0 in 2005. The data has a rising trend.
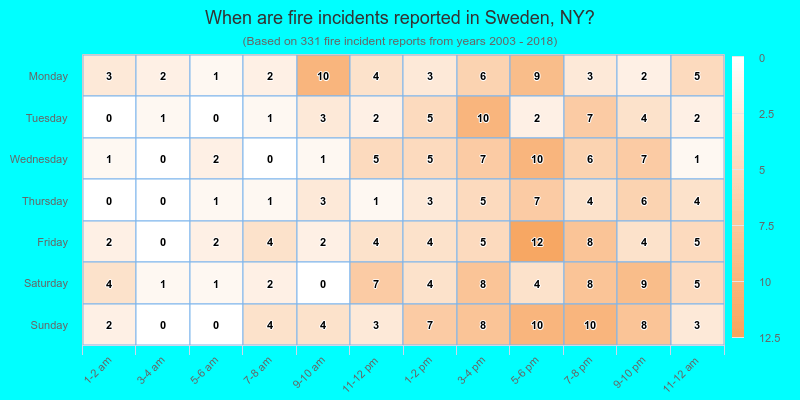
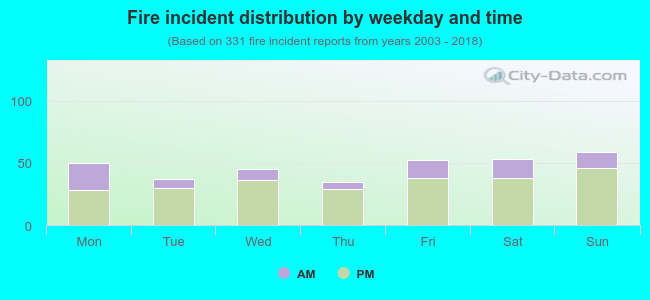 26.0% incidents where reported in the morning and 74.0% in the evening. The most fires (17.8%) took place on Sunday, and the least (10.6%) on Thursday.
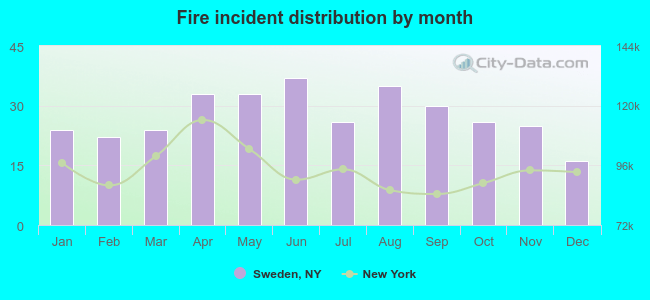 According to the 331 reports from years 2003 - 2018 most fires (11.2%) took place during June, and the least (4.8%) in December.
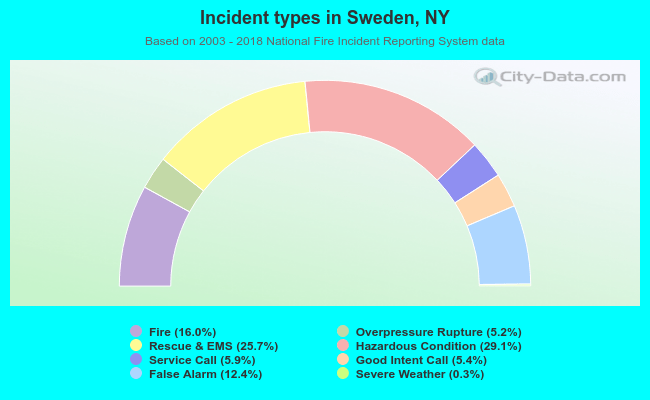 Out of all 2,075 cases reported during the years 2003 - 2018, the most belonged to the categories: Hazardous Condition (29.1%), Rescue & EMS (25.7%), and Fire (16.0%).
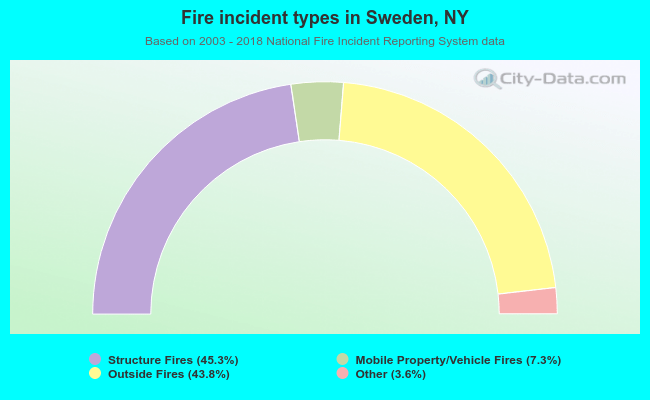 When looking into fire subcategories, the most incidents belonged to: Structure Fires (45.3%), and Outside Fires (43.8%).