Hamlin: Fire Incidents, New York (NY)
Where are fire incidents reported in Hamlin, NY
Something went wrong! Please refresh the page.
|
| |||||||||||||||||||||||||||||||||||||||||||||||||||||||||||||||||||||||||||||||||||||||||||||||||||||||||||||
2002 - 2018 National Fire Incident Reporting System (NFIRS) incidents
- Incident types reported to NFIRS in Hamlin, NY
- 1,82845.0%Rescue & EMS
- 85321.0%Hazardous Condition
- 57414.1%Fire
- 3468.5%Good Intent Call
- 2857.0%Service Call
- 1263.1%False Alarm
- 451.1%Severe Weather
- Fire incident types reported to NFIRS in Hamlin, NY
- 23540.9%Structure Fires
- 23240.4%Outside Fires
- 549.4%Mobile Property/Vehicle Fires
- 539.2%Other
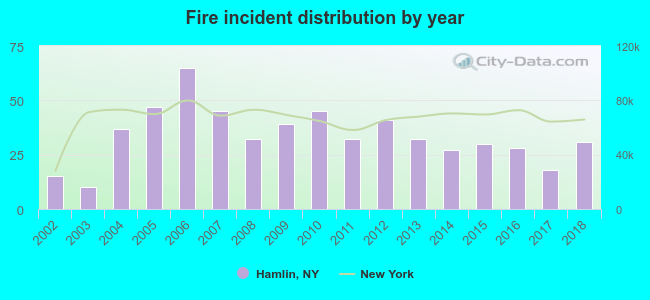 According to the data from the years 2002 - 2018 the average number of fire incidents per year is 34. The highest number of fires - 65 took place in 2006, and the least - 10 in 2003. The data has an increasing trend.
The average number of yearly fire incidents per 10k residents in Hamlin, NY compared to nearest cities:
(Note: Based on data for the last 3 years, including only cities with population 5,000 and above)
| Hamlin: | 28.4 |
| Clarkson: | 31.2 |
| Hilton: | 29.1 |
| Parma: | 10.2 |
| Brockport: | 29.8 |
| Sweden: | 15.0 |
| Ogden: | 0.5 |
| Greece: | 81.3 |
| Albion: | 91.0 |
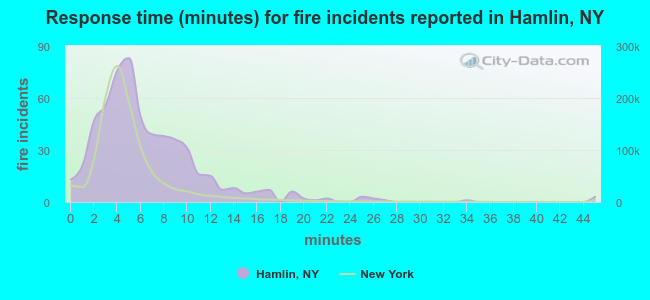 The median response time based on all reported fire incidents is 5 minutes. This is higher compared to the New York median value.
The median response time in Hamlin, NY compared to nearest cities:
(Note: Based on data for all years, including only cities with at least 500 fire incidents)
| Hamlin: | 5 minutes |
| Hilton: | 5 minutes |
| Brockport: | 5 minutes |
| Spencerport: | 8 minutes |
| Albion: | 7 minutes |
| Rochester: | 4 minutes |
| Medina: | 5 minutes |
| Penfield: | 7 minutes |
| Batavia: | 4 minutes |
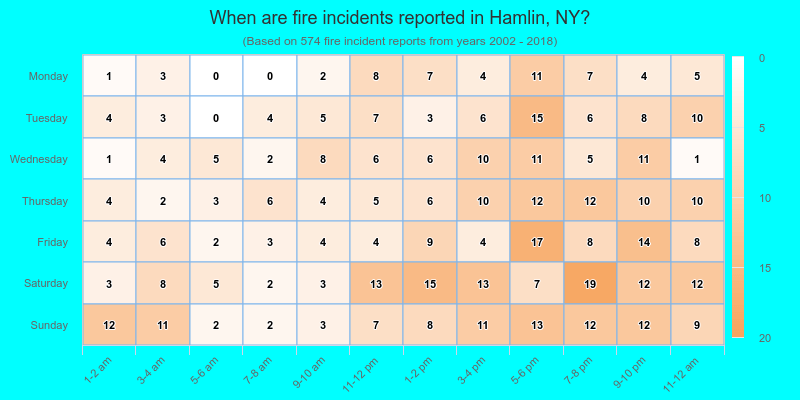
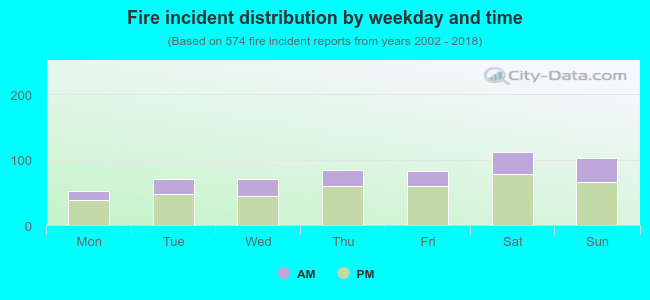 31.5% incidents where reported in the morning and 68.5% in the evening. The most fires (19.5%) took place on Saturday, and the least (9.1%) on Monday.
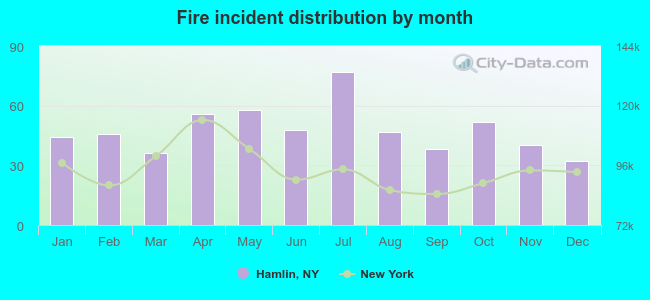 Based on the 574 fires from years 2002 - 2018 most fires (13.4%) took place during July, and the least (5.6%) in December.
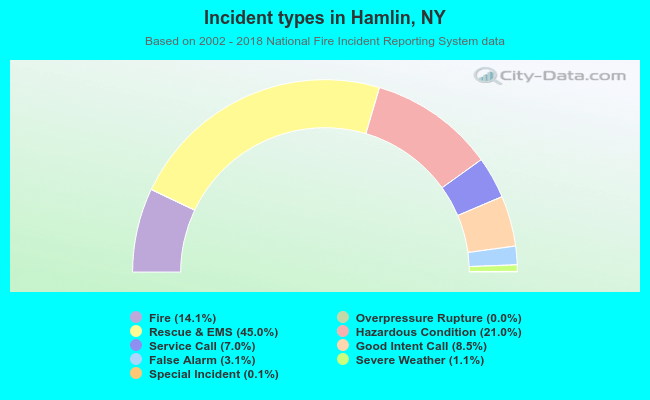 Out of all 4,061 cases reported during the years 2002 - 2018, the most belonged to the categories: Rescue & EMS (45.0%), Hazardous Condition (21.0%), and Fire (14.1%).
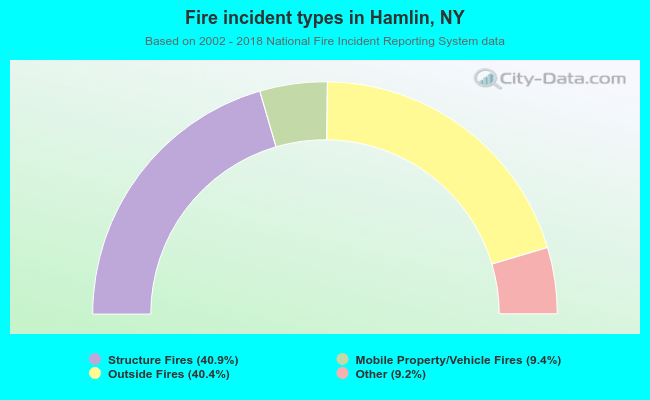 When looking into fire subcategories, the most incidents belonged to: Structure Fires (40.9%), and Outside Fires (40.4%).