Swampscott: Fire Incidents, Massachusetts (MA)
Where are fire incidents reported in Swampscott, MA
Something went wrong! Please refresh the page.
| Fire incidents reported | |
|---|---|
| Sreet name | Count |
| PARADISE RD | 370 |
| HUMPHREY ST | 150 |
| ESSEX ST | 86 |
| BURRILL ST | 56 |
| BURPEE RD | 50 |
| PURITAN RD | 38 |
| MIDDLESEX AVE | 26 |
| FOREST AVE | 20 |
| NORFOLK AVE | 18 |
| VANTAGE TER | 18 |
| ATLANTIC AVE | 16 |
| DOHERTY CIR | 16 |
| STETSON AVE | 16 |
| COLUMBIA ST | 14 |
| REDINGTON ST | 14 |
| SALEM ST | 14 |
| LITTLES POINT RD | 12 |
| LORING AVE | 12 |
| OCEAN AVE | 12 |
| PHILLIPS BEACH AVE | 12 |
| ROCK AVE | 12 |
| THOMAS RD | 12 |
| WALKER RD | 12 |
| DANVERS RD | 10 |
| ELMWOOD RD | 10 |
| FOSTER RD | 10 |
| PLYMOUTH AVE | 10 |
| RAILROAD AVE | 10 |
| ALDEN RD | 8 |
| ARCHER ST | 8 |
2002 - 2018 National Fire Incident Reporting System (NFIRS) incidents
- Incident types reported to NFIRS in Swampscott, MA
- 6,22544.0%Rescue & EMS
- 2,44417.3%Hazardous Condition
- 1,90613.5%False Alarm
- 1,71812.1%Service Call
- 9286.6%Fire
- 7165.1%Good Intent Call
- 1441.0%Special Incident
- 450.3%Overpressure Rupture
- 180.1%Severe Weather
- Fire incident types reported to NFIRS in Swampscott, MA
- 51755.7%Structure Fires
- 29531.8%Outside Fires
- 697.4%Mobile Property/Vehicle Fires
- 475.1%Other
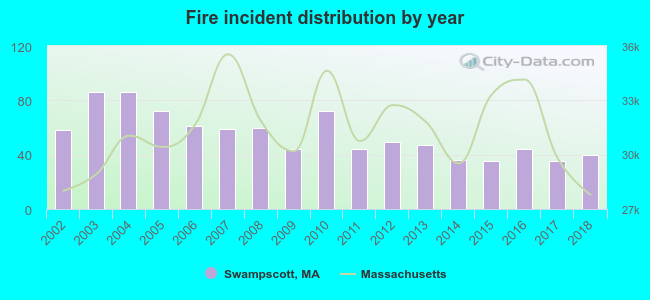 Based on the data from the years 2002 - 2018 the average number of fires per year is 55. The highest number of reported fires - 86 took place in 2003, and the least - 35 in 2015. The data has a dropping trend.
The average number of yearly fire incidents per 10k residents in Swampscott, MA compared to nearest cities:
(Note: Based on data for the last 3 years, including only cities with population 5,000 and above)
| Swampscott: | 28.8 |
| Lynn: | 45.3 |
| Marblehead: | 19.2 |
| Salem: | 37.4 |
| Peabody: | 23.0 |
| Saugus: | 48.2 |
| Beverly: | 25.5 |
| Revere: | 68.1 |
| Danvers: | 40.5 |
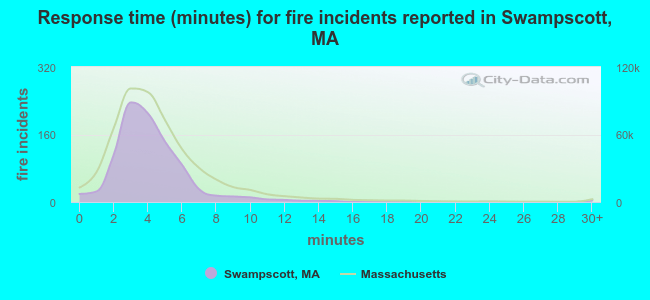 The median response time based on all reported fire incidents is 4 minutes. This is similar to the state median value.
The median response time in Swampscott, MA compared to nearest cities:
(Note: Based on data for all years, including only cities with at least 500 fire incidents)
| Swampscott: | 4 minutes |
| Lynn: | 4 minutes |
| Marblehead: | 4 minutes |
| Salem: | 3 minutes |
| Peabody: | 5 minutes |
| Saugus: | 5 minutes |
| Beverly: | 4 minutes |
| Revere: | 3 minutes |
| Danvers: | 5 minutes |
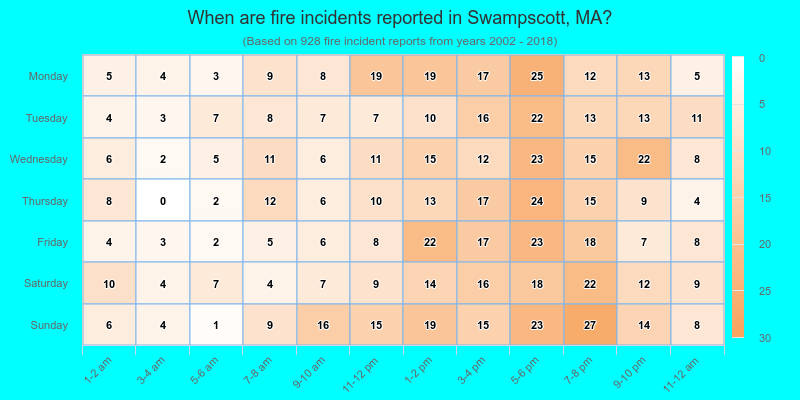
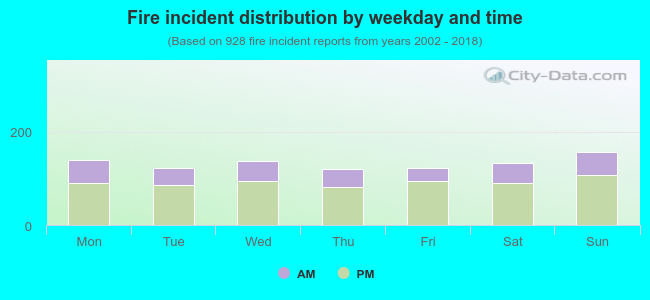 30.5% incidents where reported in the morning and 69.5% in the evening. The most fires (16.9%) took place on Sunday, and the least (12.9%) on Thursday.
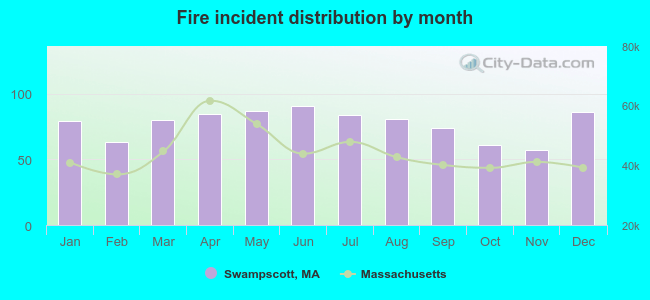 According to the 928 fire incident reports from years 2002 - 2018 most fires (9.8%) took place during June, and the least (6.1%) in November.
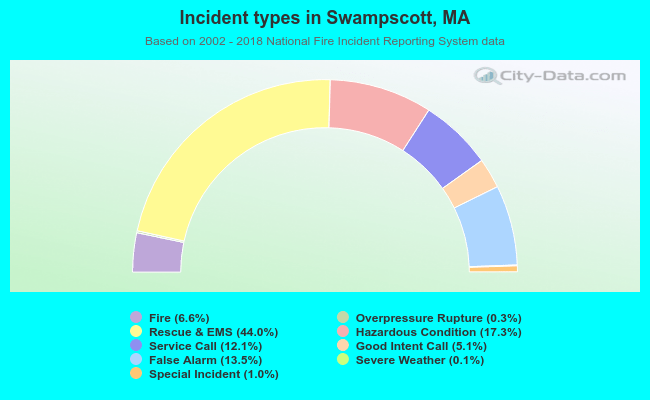 Out of all 14,144 cases reported during the years 2002 - 2018, the most belonged to the categories: Rescue & EMS (44.0%), Hazardous Condition (17.3%), and False Alarm (13.5%).
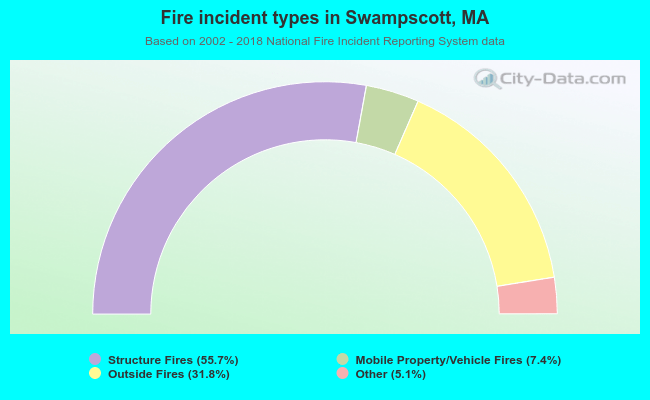 When looking into fire subcategories, the most reports belonged to: Structure Fires (55.7%), and Outside Fires (31.8%).