Salem: Fire Incidents, Massachusetts (MA)
Where are fire incidents reported in Salem, MA
Something went wrong! Please refresh the page.
| Fire incidents reported | |
|---|---|
| Sreet name | Count |
| HIGHLAND AVENUE | 536 |
| LAFAYETTE STREET | 454 |
| ESSEX STREET | 342 |
| BRIDGE STREET | 300 |
| WASHINGTON STREET | 296 |
| NORTH STREET | 292 |
| TRADERS WAY | 286 |
| LORING AVENUE | 260 |
| BOSTON STREET | 196 |
| FIRST STREET | 184 |
| CONGRESS STREET | 156 |
| CANAL STREET | 136 |
| POPE STREET | 120 |
| DERBY STREET | 116 |
| FEDERAL STREET | 112 |
| WARD STREET | 110 |
| FORT AVENUE | 108 |
| JEFFERSON AVENUE | 108 |
| HARBOR STREET | 98 |
| HERITAGE DRIVE | 98 |
| RAINBOW TERRACE | 94 |
| PALMER STREET | 82 |
| SWAMPSCOTT ROAD | 72 |
| LEACH STREET | 70 |
| DOW STREET | 66 |
| GROVE STREET | 62 |
| MARLBOROUGH ROAD | 58 |
| PEABODY STREET | 58 |
| SALEM STREET | 58 |
| BROAD STREET | 54 |
2002 - 2018 National Fire Incident Reporting System (NFIRS) incidents
- Incident types reported to NFIRS in Salem, MA
- 17,73840.5%Rescue & EMS
- 8,41819.2%False Alarm
- 7,22516.5%Hazardous Condition
- 4,38010.0%Fire
- 3,6648.4%Service Call
- 2,1274.9%Good Intent Call
- 2160.5%Severe Weather
- 510.1%Overpressure Rupture
- Fire incident types reported to NFIRS in Salem, MA
- 2,43855.7%Structure Fires
- 1,61036.8%Outside Fires
- 2846.5%Mobile Property/Vehicle Fires
- 481.1%Other
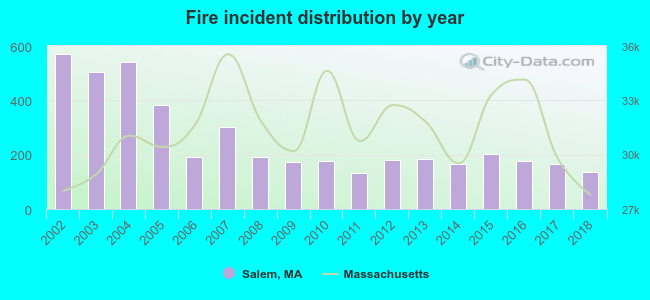 Based on the data from the years 2002 - 2018 the average number of fires per year is 258. The highest number of fires - 571 took place in 2002, and the least - 132 in 2011. The data has a declining trend.
The average number of yearly fire incidents per 10k residents in Salem, MA compared to nearest cities:
(Note: Based on data for the last 3 years, including only cities with population 5,000 and above)
| Salem: | 37.4 |
| Marblehead: | 19.2 |
| Swampscott: | 28.8 |
| Beverly: | 25.5 |
| Peabody: | 23.0 |
| Lynn: | 45.3 |
| Danvers: | 40.5 |
| Lynnfield: | 81.9 |
| Saugus: | 48.2 |
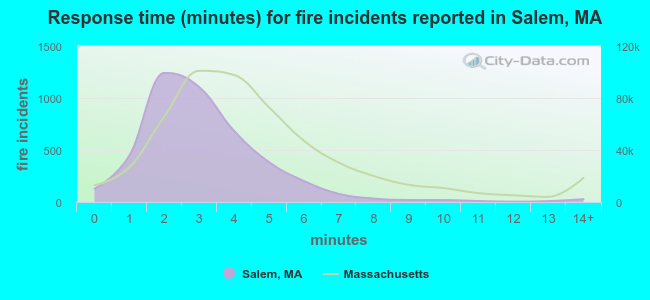 The median response time based on all reported fire incidents is 3 minutes. This is lower compared to the Massachusetts median value.
The median response time in Salem, MA compared to nearest cities:
(Note: Based on data for all years, including only cities with at least 500 fire incidents)
| Salem: | 3 minutes |
| Marblehead: | 4 minutes |
| Swampscott: | 4 minutes |
| Beverly: | 4 minutes |
| Peabody: | 5 minutes |
| Lynn: | 4 minutes |
| Danvers: | 5 minutes |
| Lynnfield: | 5 minutes |
| Saugus: | 5 minutes |
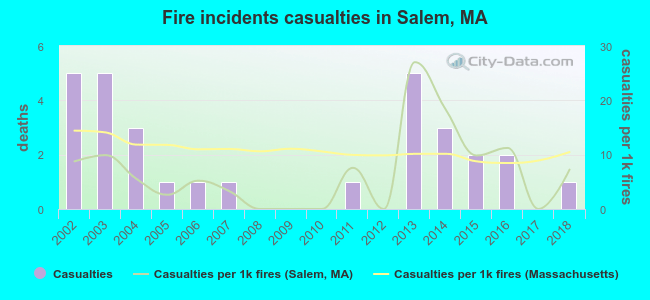 According to the reports from the years 2002 - 2018 the average number of fire-related yearly casualties is 2. The highest number of reported injuries - 5 took place in 2002, and the lowest - 0 in 2008. The data has a declining trend.
The average number of injuries per 1,000 fires is 7. This indicator was the highest - 27 in 2013, and the lowest 0 in 2008. The trend for injuries per 1,000 incidents is dropping. Compared to the Massachusetts value the number of injuries per 1,000 fire incidents is lower.
According to the reports from the years 2002 - 2018 the average number of fire-related yearly casualties is 2. The highest number of reported injuries - 5 took place in 2002, and the lowest - 0 in 2008. The data has a declining trend.
The average number of injuries per 1,000 fires is 7. This indicator was the highest - 27 in 2013, and the lowest 0 in 2008. The trend for injuries per 1,000 incidents is dropping. Compared to the Massachusetts value the number of injuries per 1,000 fire incidents is lower.Casualties per 1,000 incidents in Salem, MA compared to nearest cities:
(Note: Based on data for all years, including only cities with at least 500 fire incidents)
| Salem: | 6.8 |
| Marblehead: | 6.5 |
| Swampscott: | 6.5 |
| Beverly: | 8.3 |
| Peabody: | 6.9 |
| Lynn: | 10.4 |
| Danvers: | 4.1 |
| Lynnfield: | 2.5 |
| Saugus: | 11.2 |
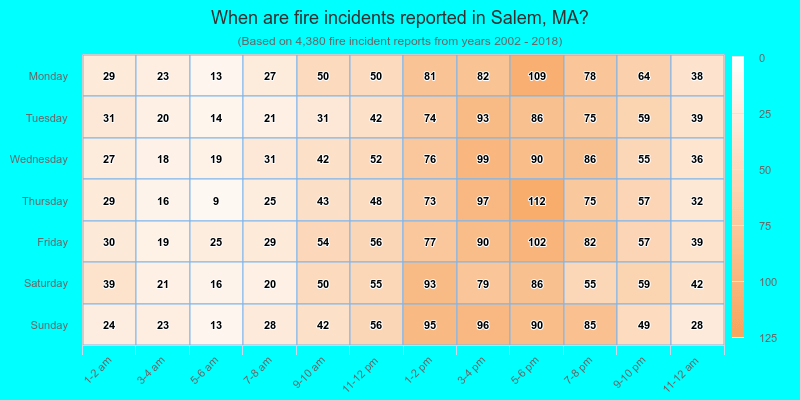
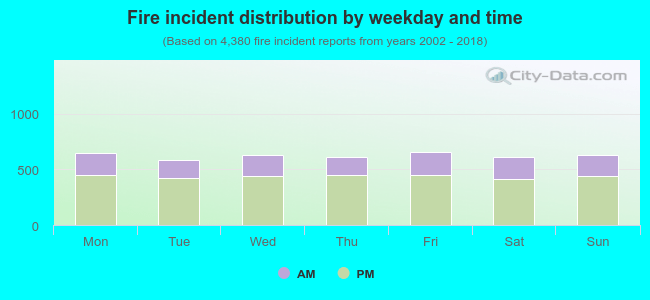 29.9% incidents where reported in the morning and 70.1% in the evening. The most fires (15.1%) took place on Friday, and the least (13.4%) on Tuesday.
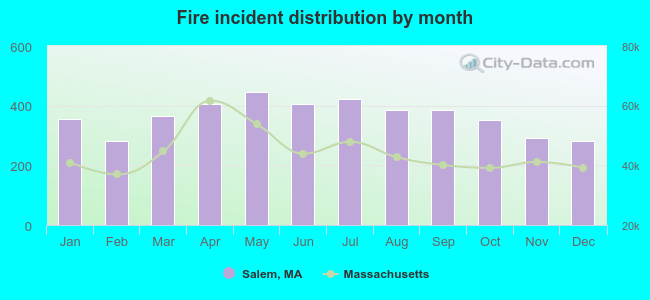 Based on the 4,380 reports from years 2002 - 2018 most fires (10.2%) took place during May, and the least (6.4%) in December.
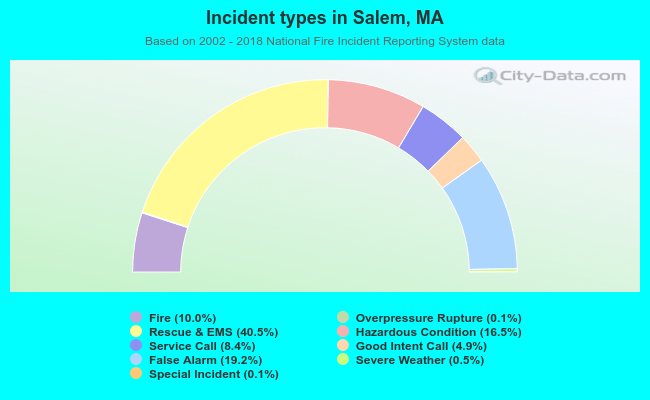 Out of all 43,844 cases reported during the years 2002 - 2018, the most belonged to the categories: Rescue & EMS (40.5%), False Alarm (19.2%), and Hazardous Condition (16.5%).
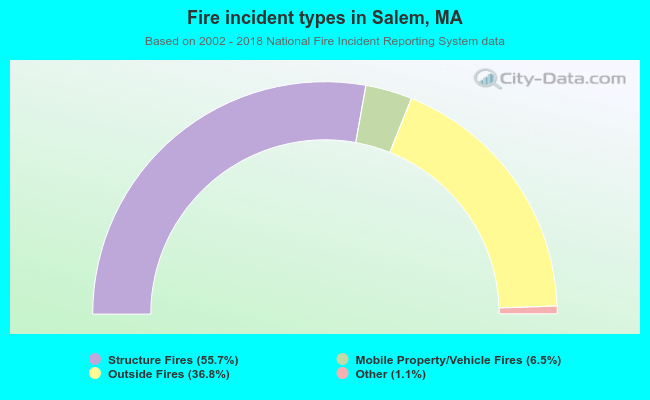 When looking into fire subcategories, the most reports belonged to: Structure Fires (55.7%), and Outside Fires (36.8%).