Stroudsburg: Fire Incidents, Pennsylvania (PA)
Where are fire incidents reported in Stroudsburg, PA
Something went wrong! Please refresh the page.
|
| |||||||||||||||||||||||||||||||||||||||||||||||||||||||||||||||||||||||||||||||||||||||||||||||||||||||||||||
2011 - 2018 National Fire Incident Reporting System (NFIRS) incidents
- Incident types reported to NFIRS in Stroudsburg, PA
- 31134.9%False Alarm
- 19521.9%Fire
- 15617.5%Hazardous Condition
- 11913.3%Good Intent Call
- 718.0%Rescue & EMS
- 353.9%Service Call
- 20.2%Overpressure Rupture
- 20.2%Special Incident
- 10.1%Severe Weather
- Fire incident types reported to NFIRS in Stroudsburg, PA
- 9448.2%Structure Fires
- 4523.1%Mobile Property/Vehicle Fires
- 3819.5%Outside Fires
- 189.2%Other
 Based on the data from the years 2011 - 2018 the average number of fires per year is 24. The highest number of reported fires - 40 took place in 2011, and the least - 4 in 2013. The data has a declining trend.
The average number of yearly fire incidents per 10k residents in Stroudsburg, PA compared to nearest cities:
(Note: Based on data for the last 3 years, including only cities with population 5,000 and above)
| Stroudsburg: | 52.4 |
| East Stroudsburg: | 39.8 |
| Bangor: | 32.5 |
| Nazareth: | 52.5 |
| Easton: | 77.1 |
| Wilson: | 3.2 |

 31.8% incidents where reported in the morning and 68.2% in the evening. The most fires (16.9%) took place on Sunday, and the least (11.8%) on Thursday.
 Based on the 195 fire incidents from years 2011 - 2018 most fires (12.8%) took place during March, and the least (5.6%) in September.
 Out of all 892 cases reported during the years 2011 - 2018, the most belonged to the categories: False Alarm (34.9%), Fire (21.9%), and Hazardous Condition (17.5%).
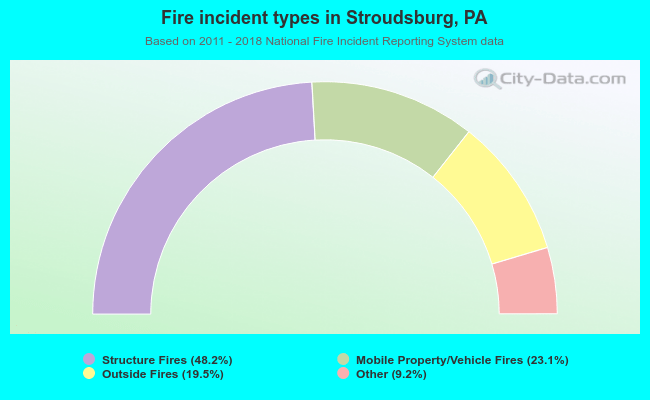 When looking into fire subcategories, the most reports belonged to: Structure Fires (48.2%), and Mobile Property/Vehicle Fires (23.1%).