Nazareth: Fire Incidents, Pennsylvania (PA)
Where are fire incidents reported in Nazareth, PA
Something went wrong! Please refresh the page.
|
| |||||||||||||||||||||||||||||||||||||||||||||||||||||||||||||||||||||||||||||||||||||||||||||||||||||||||||||
2004 - 2018 National Fire Incident Reporting System (NFIRS) incidents
- Incident types reported to NFIRS in Nazareth, PA
- 24224.1%Fire
- 18618.5%Rescue & EMS
- 16015.9%False Alarm
- 15915.8%Hazardous Condition
- 12112.0%Good Intent Call
- 888.7%Service Call
- 313.1%Severe Weather
- 171.7%Special Incident
- 20.2%Overpressure Rupture
- Fire incident types reported to NFIRS in Nazareth, PA
- 14359.1%Structure Fires
- 4016.5%Outside Fires
- 3715.3%Other
- 229.1%Mobile Property/Vehicle Fires
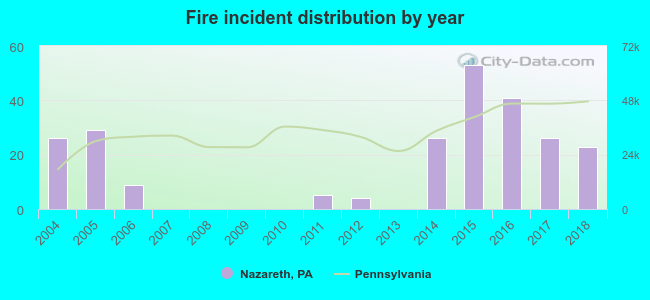 Based on the data from the years 2004 - 2018 the average number of fires per year is 16. The highest number of fires - 53 took place in 2015, and the least - 0 in 2007. The data has a dropping trend.
The average number of yearly fire incidents per 10k residents in Nazareth, PA compared to nearest cities:
(Note: Based on data for the last 3 years, including only cities with population 5,000 and above)
| Nazareth: | 52.5 |
| Wilson: | 3.2 |
| Easton: | 77.1 |
| Bethlehem: | 29.6 |
| Catasauqua: | 59.4 |
| Northampton: | 71.3 |
| Bangor: | 32.5 |
| Hellertown: | 22.2 |
| Allentown: | 11.6 |

 33.5% incidents where reported in the morning and 66.5% in the evening. The most fires (16.9%) took place on Thursday, and the least (12.8%) on Wednesday.
 According to the 242 fire incidents from years 2004 - 2018 most fires (15.3%) took place during April, and the least (4.5%) in November.
 Out of all 1,006 cases reported during the years 2004 - 2018, the most belonged to the categories: Fire (24.1%), Rescue & EMS (18.5%), and False Alarm (15.9%).
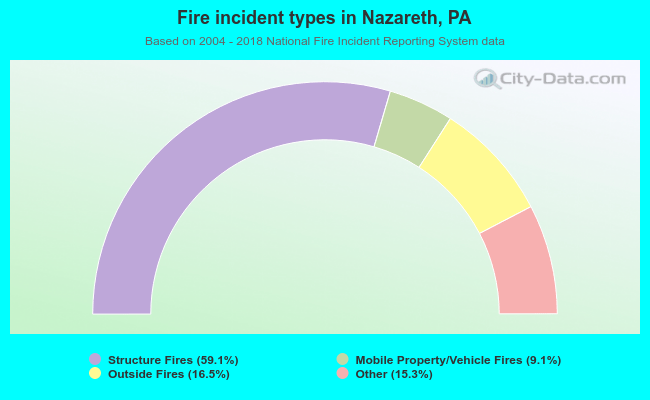 When looking into fire subcategories, the most reports belonged to: Structure Fires (59.1%), and Outside Fires (16.5%).