Stephenville: Fire Incidents, Texas (TX)
Where are fire incidents reported in Stephenville, TX
Something went wrong! Please refresh the page.
| Fire incidents reported | |
|---|---|
| Sreet name | Count |
| WASHINGTON ST | 224 |
| LINGLEVILLE RD | 62 |
| LONG ST | 48 |
| FREY ST | 30 |
| GRAHAM ST | 26 |
| SOUTH LOOP | 26 |
| 281 | 22 |
| GLEN ROSE RD | 22 |
| SOUTH LOOP | 22 |
| TARLETON ST | 22 |
| VANDERBILT ST | 22 |
| HARBIN DR | 20 |
| FM 8 | 18 |
| SWAN ST | 18 |
| GRAHAM AVE | 16 |
| LILLIAN AVE | 16 |
| PARK ST | 16 |
| SHIRLEY ST | 16 |
| 249 CR 454 | 14 |
| 914 | 14 |
| BROADWAY ST | 14 |
| COLLEGE ST | 14 |
| LILLIAN ST | 14 |
| MORGAN MILL RD | 14 |
| WASHINGTON | 14 |
| 12016 US 377 NORTH | 12 |
| ALEXANDER RD | 12 |
| CROW ST | 12 |
| ELM ST | 12 |
| FM 205 | 12 |
| Other | 1,749 |
2004 - 2018 National Fire Incident Reporting System (NFIRS) incidents
- Incident types reported to NFIRS in Stephenville, TX
- 6,83360.1%Rescue & EMS
- 2,55322.5%Fire
- 6365.6%Hazardous Condition
- 6115.4%Good Intent Call
- 4233.7%Service Call
- 2652.3%False Alarm
- 380.3%Special Incident
- Fire incident types reported to NFIRS in Stephenville, TX
- 1,67665.6%Outside Fires
- 42316.6%Structure Fires
- 29511.6%Mobile Property/Vehicle Fires
- 1596.2%Other
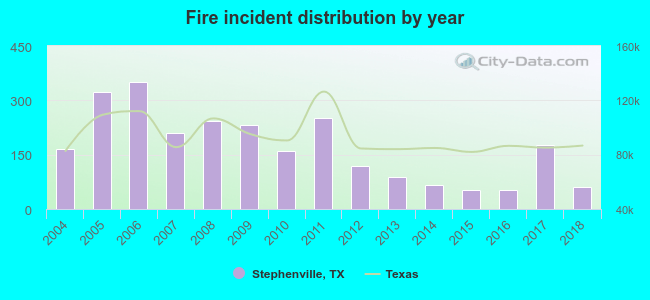 According to the data from the years 2004 - 2018 the average number of fires per year is 170. The highest number of fires - 350 took place in 2006, and the least - 52 in 2015. The data has a declining trend.
The average number of yearly fire incidents per 10k residents in Stephenville, TX compared to nearest cities:
(Note: Based on data for the last 3 years, including only cities with population 5,000 and above)
| Stephenville: | 50.1 |
| Granbury: | 357.9 |
| Mineral Wells: | 101.5 |
| Weatherford: | 133.4 |
| Cleburne: | 78.2 |
| Joshua: | 141.1 |
| Keene: | 99.7 |
| Benbrook: | 45.2 |
| Breckenridge: | 190.6 |
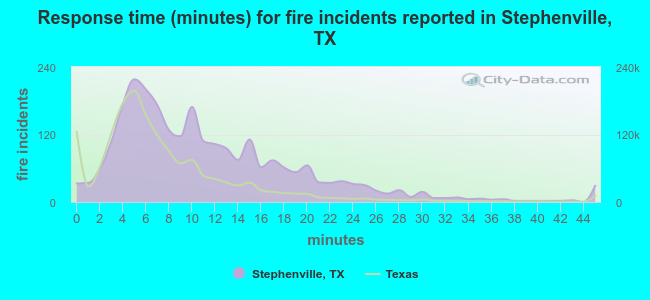 The median response time based on all reported fire incidents is 10 minutes. This is higher than the Texas median value.
The median response time in Stephenville, TX compared to nearest cities:
(Note: Based on data for all years, including only cities with at least 500 fire incidents)
| Stephenville: | 10 minutes |
| Tolar: | 11 minutes |
| Granbury: | 12 minutes |
| Ranger: | 9 minutes |
| Hamilton: | 12 minutes |
| Eastland: | 7 minutes |
| Millsap: | 12 minutes |
| Mineral Wells: | 7 minutes |
| Godley: | 13 minutes |
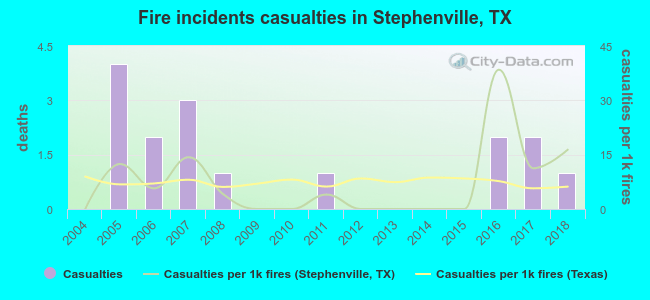 Based on the data from the years 2004 - 2018 the average number of fire-related yearly casualties is 1. The highest number of injuries - 4 took place in 2005, and the lowest - 0 in 2004. The data has a rising trend.
The average number of casualties per 1,000 fires is 7. This indicator was the highest - 38 in 2016, and the lowest 0 in 2004. The trend for injuries per 1,000 fires is growing. Compared to the Texas value the number of injuries per 1,000 incidents is lower.
Based on the data from the years 2004 - 2018 the average number of fire-related yearly casualties is 1. The highest number of injuries - 4 took place in 2005, and the lowest - 0 in 2004. The data has a rising trend.
The average number of casualties per 1,000 fires is 7. This indicator was the highest - 38 in 2016, and the lowest 0 in 2004. The trend for injuries per 1,000 fires is growing. Compared to the Texas value the number of injuries per 1,000 incidents is lower.
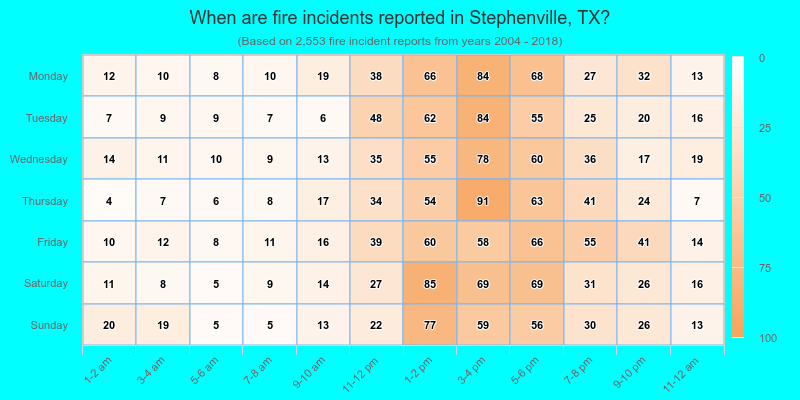
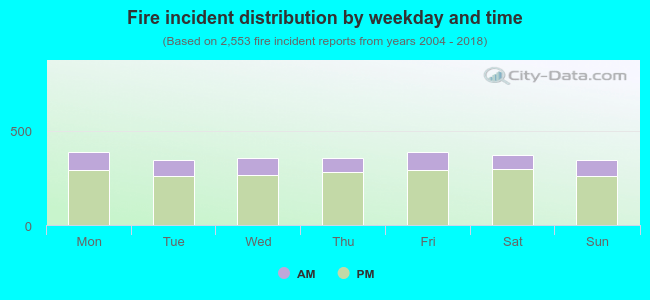 23.7% incidents where reported in the morning and 76.3% in the evening. The most fires (15.3%) took place on Friday, and the least (13.5%) on Sunday.
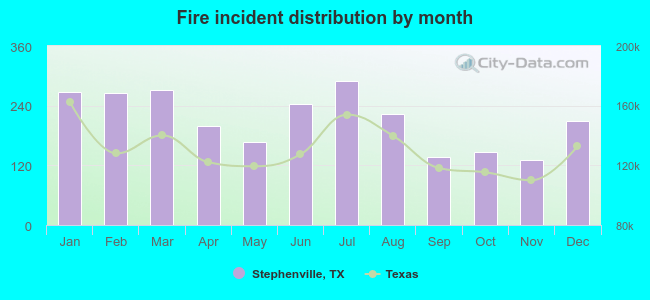 Based on the 2,553 fire incident reports from years 2004 - 2018 most fires (11.3%) took place during July, and the least (5.1%) in November.
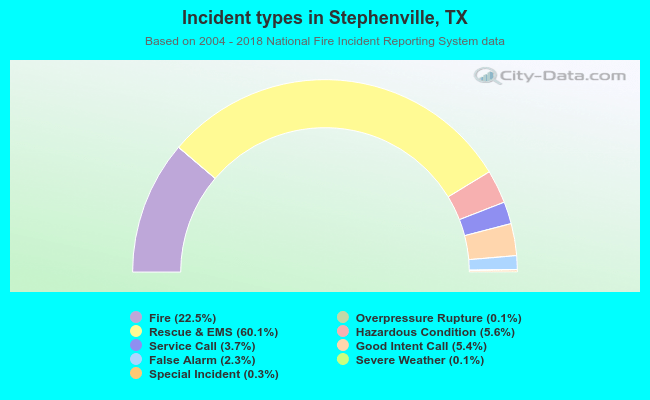 Out of all 11,371 cases reported during the years 2004 - 2018, the most belonged to the categories: Rescue & EMS (60.1%), Fire (22.5%), and Hazardous Condition (5.6%).
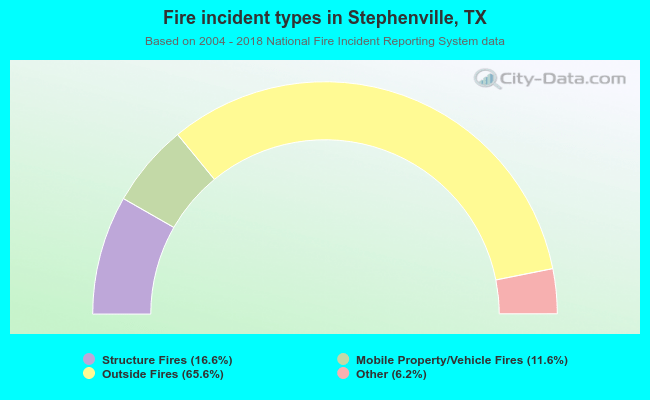 When looking into fire subcategories, the most reports belonged to: Outside Fires (65.6%), and Structure Fires (16.6%).