Steamboat Springs: Fire Incidents, Colorado (CO)
Where are fire incidents reported in Steamboat Springs, CO
Something went wrong! Please refresh the page.
|
| |||||||||||||||||||||||||||||||||||||||||||||||||||||||||||||||||||||||||||||||||||||||||||||||||||||||||||||
| Other | 130 | |||||||||||||||||||||||||||||||||||||||||||||||||||||||||||||||||||||||||||||||||||||||||||||||||||||||||||||
2004 - 2018 National Fire Incident Reporting System (NFIRS) incidents
- Incident types reported to NFIRS in Steamboat Springs, CO
- 4,19552.3%Rescue & EMS
- 1,44218.0%Good Intent Call
- 99912.4%False Alarm
- 7339.1%Hazardous Condition
- 4265.3%Fire
- 2182.7%Service Call
- Fire incident types reported to NFIRS in Steamboat Springs, CO
- 17841.8%Outside Fires
- 15135.4%Structure Fires
- 5512.9%Mobile Property/Vehicle Fires
- 429.9%Other
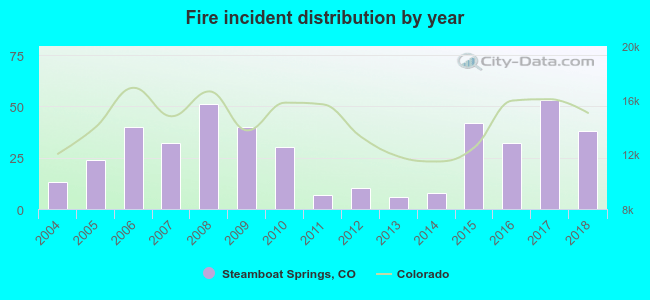 Based on the data from the years 2004 - 2018 the average number of fire incidents per year is 28. The highest number of reported fires - 53 took place in 2017, and the least - 6 in 2013. The data has an increasing trend.
The average number of yearly fire incidents per 10k residents in Steamboat Springs, CO compared to nearest cities:
(Note: Based on data for the last 3 years, including only cities with population 5,000 and above)
| Steamboat Springs: | 33.4 |
| Craig: | 69.3 |
| Eagle: | 29.9 |
| Gypsum: | 44.6 |
| Edwards: | 19.2 |
| Avon: | 27.4 |
| Vail: | 78.2 |
| Livermore: | 71.4 |
| Estes Park: | 56.2 |
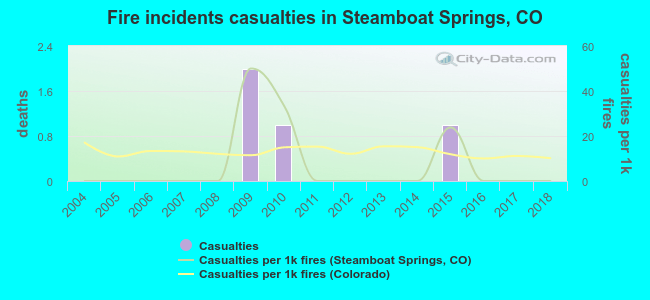 According to the reports from the years 2004 - 2018 the average number of fire-related yearly casualties is 0. The highest number of injuries - 2 took place in 2009, and the lowest - 0 in 2004. The data has a constant trend.
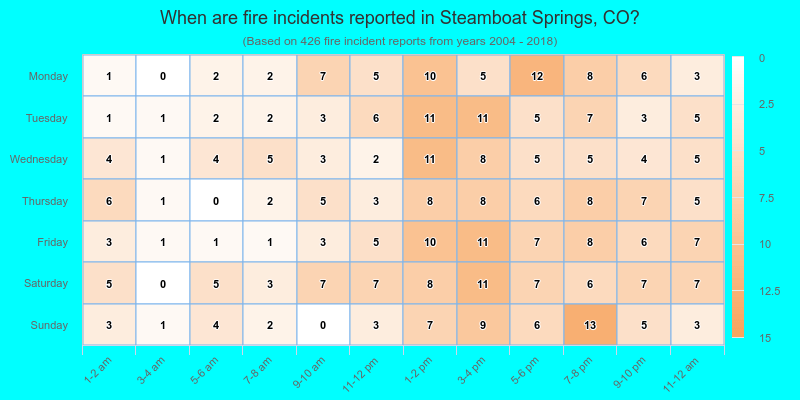
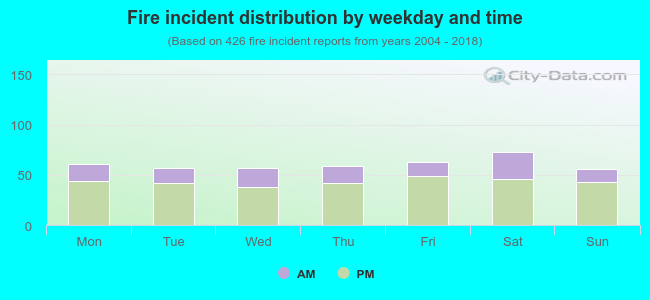 28.6% incidents where reported in the morning and 71.4% in the evening. The most fires (17.1%) took place on Saturday, and the least (13.1%) on Sunday.
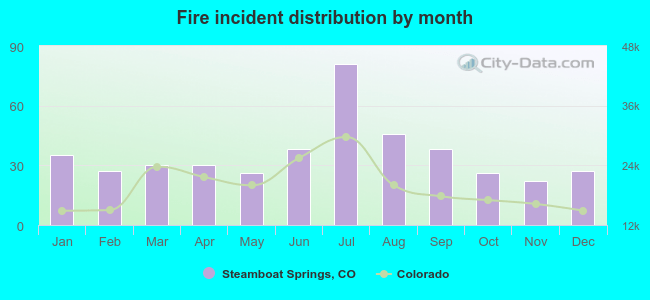 Based on the 426 reports from years 2004 - 2018 most fires (19.0%) took place during July, and the least (5.2%) in November.
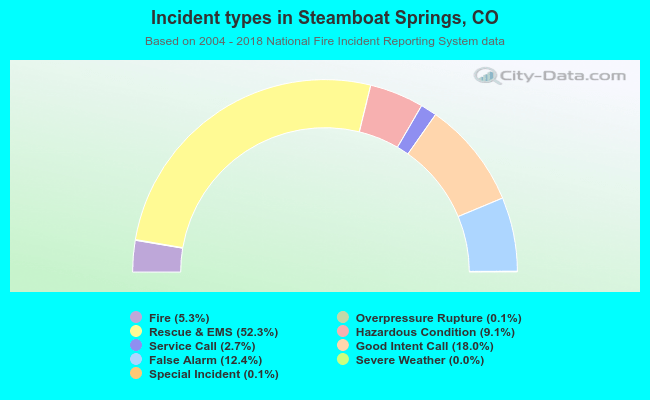 Out of all 8,026 cases reported during the years 2004 - 2018, the most belonged to the categories: Rescue & EMS (52.3%), Good Intent Call (18.0%), and False Alarm (12.4%).
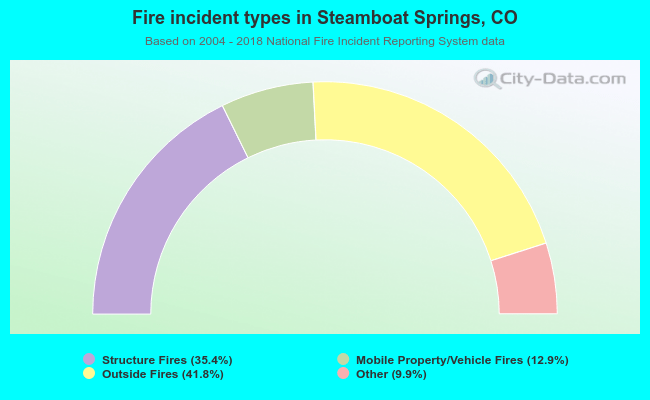 When looking into fire subcategories, the most reports belonged to: Outside Fires (41.8%), and Structure Fires (35.4%).