Avon: Fire Incidents, Colorado (CO)
Where are fire incidents reported in Avon, CO
Something went wrong! Please refresh the page.
|
| |||||||||||||||||||||||||||||||||||||||||||||||||||||||||||||||||||||||||||||||||||||||||||||||||||||||||||||
2002 - 2018 National Fire Incident Reporting System (NFIRS) incidents
- Incident types reported to NFIRS in Avon, CO
- 80231.2%Rescue & EMS
- 72028.0%False Alarm
- 33413.0%Good Intent Call
- 32012.4%Hazardous Condition
- 1937.5%Service Call
- 1897.3%Fire
- 120.5%Overpressure Rupture
- Fire incident types reported to NFIRS in Avon, CO
- 10254.0%Structure Fires
- 5629.6%Outside Fires
- 2613.8%Mobile Property/Vehicle Fires
- 52.6%Other
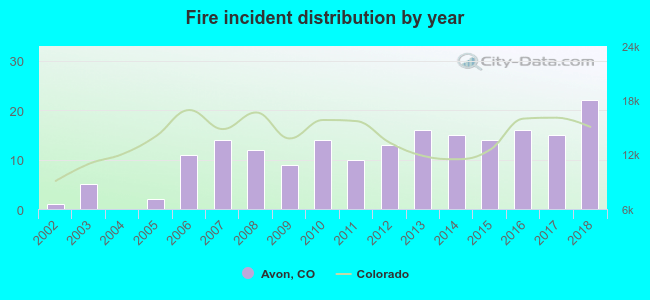 Based on the data from the years 2002 - 2018 the average number of fire incidents per year is 11. The highest number of fires - 22 took place in 2018, and the least - 0 in 2004. The data has an increasing trend.
The average number of yearly fire incidents per 10k residents in Avon, CO compared to nearest cities:
(Note: Based on data for the last 3 years, including only cities with population 5,000 and above)
| Avon: | 27.4 |
| Edwards: | 19.2 |
| Vail: | 78.2 |
| Eagle: | 29.9 |
| Gypsum: | 44.6 |
| Aspen: | 23.5 |
| Carbondale: | 44.6 |
| Glenwood Springs: | 27.4 |
| Steamboat Springs: | 33.4 |
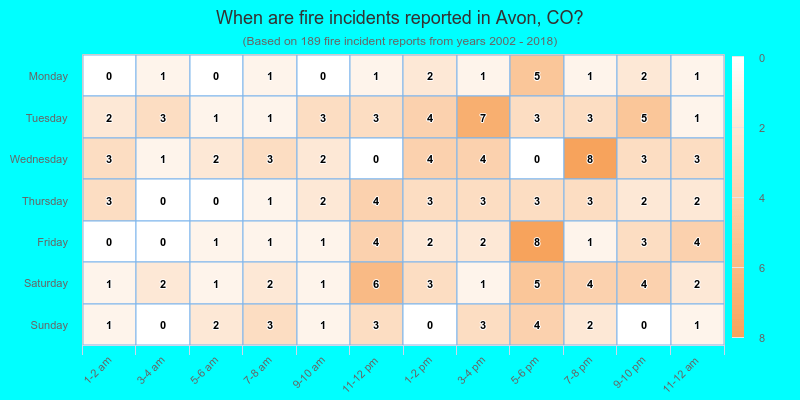
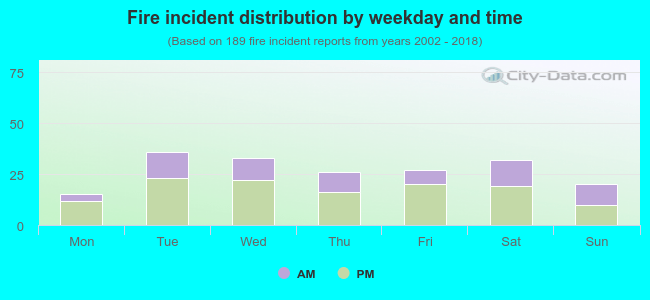 35.4% incidents where reported in the morning and 64.6% in the evening. The most fires (19.0%) took place on Tuesday, and the least (7.9%) on Monday.
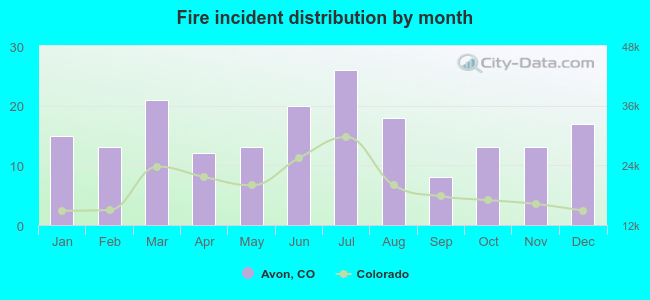 According to the 189 incident reports from years 2002 - 2018 most fires (13.8%) took place during July, and the least (4.2%) in September.
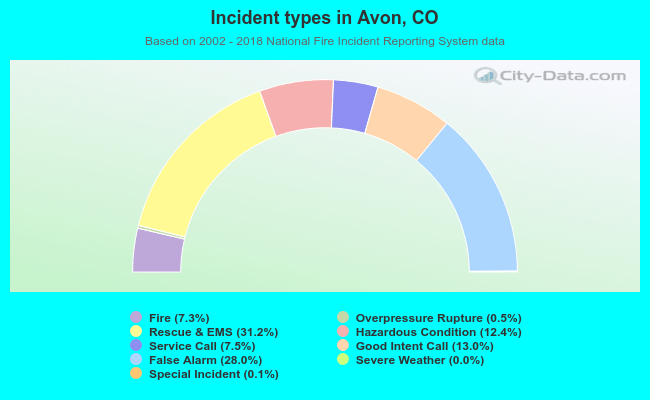 Out of all 2,573 cases reported during the years 2002 - 2018, the most belonged to the categories: Rescue & EMS (31.2%), False Alarm (28.0%), and Good Intent Call (13.0%).
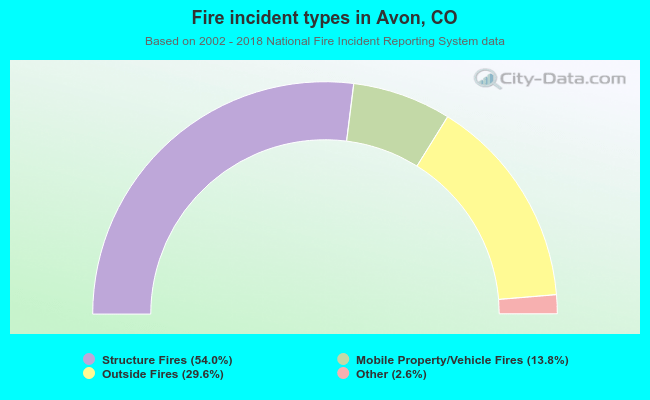 When looking into fire subcategories, the most incidents belonged to: Structure Fires (54.0%), and Outside Fires (29.6%).