St. Louis: Fire Incidents, Missouri (MO)
Where are fire incidents reported in St. Louis, MO
Something went wrong! Please refresh the page.
| Fire incidents reported | |
|---|---|
| Sreet name | Count |
| EUCLID AVE | 1,988 |
| GRAND BLVD | 1,664 |
| KINGSHIGHWAY BLVD | 1,298 |
| BROADWAY | 1,140 |
| IOWA AVE | 1,056 |
| 9TH ST | 1,048 |
| NATURAL BRIDGE AVE | 876 |
| SAINT LOUIS AVE | 608 |
| FLORISSANT AVE | 502 |
| GRAVOIS AVE | 500 |
| LINDELL BLVD | 492 |
| PAGE BLVD | 478 |
| OLIVE ST | 474 |
| CHIPPEWA ST | 454 |
| UNION BLVD | 440 |
| GOODFELLOW BLVD | 430 |
| DELMAR BLVD | 424 |
| MICHIGAN AVE | 404 |
| VIRGINIA AVE | 404 |
| JEFFERSON AVE | 388 |
| LABADIE AVE | 382 |
| DR MARTIN LUTHER KING DR | 374 |
| MAFFITT AVE | 372 |
| MINNESOTA AVE | 370 |
| CALIFORNIA AVE | 366 |
| PENNSYLVANIA AVE | 360 |
| COTE BRILLIANTE AVE | 334 |
| COMPTON AVE | 332 |
| CLEMENS AVE | 324 |
| ARLINGTON AVE | 306 |
| Other | 14,908 |
2002 - 2011 National Fire Incident Reporting System (NFIRS) incidents
- Incident types reported to NFIRS in St. Louis, MO
- 33,49649.1%Fire
- 12,83218.8%Hazardous Condition
- 12,39018.2%Rescue & EMS
- 4,8047.0%False Alarm
- 2,3803.5%Good Intent Call
- 1,9312.8%Service Call
- 3280.5%Special Incident
- Fire incident types reported to NFIRS in St. Louis, MO
- 16,52649.3%Structure Fires
- 10,13530.3%Outside Fires
- 5,40516.1%Mobile Property/Vehicle Fires
- 1,4304.3%Other
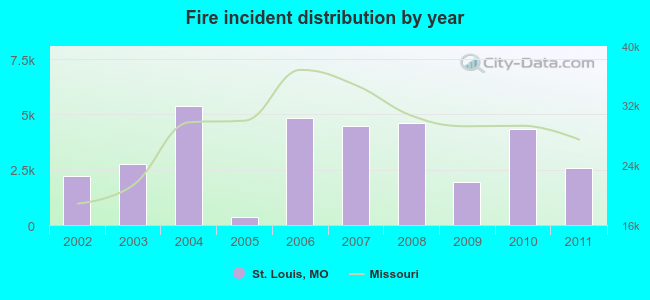 Based on the data from the years 2002 - 2011 the average number of fires per year is 3,350. The highest number of reported fire incidents - 5,397 took place in 2004, and the least - 340 in 2005. The data has a rising trend.
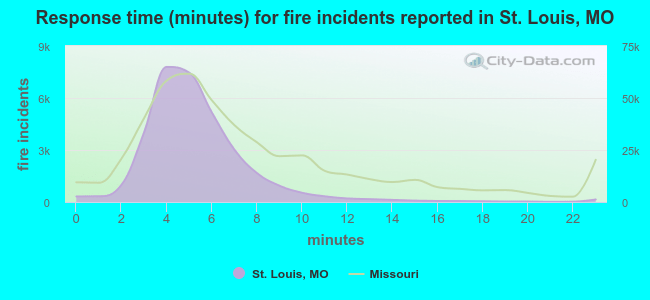 The median response time based on all reported fire incidents is 5 minutes. This is lower than the state median value.
The median response time in St. Louis, MO compared to nearest cities:
(Note: Based on data for all years, including only cities with at least 500 fire incidents)
| St. Louis: | 5 minutes |
| Maplewood: | 4 minutes |
| Richmond Heights: | 5 minutes |
| Clayton: | 4 minutes |
| University City: | 5 minutes |
| Shrewsbury: | 5 minutes |
| Brentwood: | 4 minutes |
| Cahokia: | 7 minutes |
| East St. Louis: | 6 minutes |
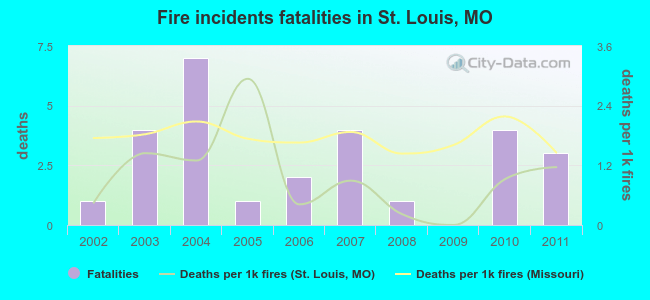 Based on the reports from the years 2002 - 2011 the average number of fire-related yearly deaths is 3. The highest number of deaths - 7 took place in 2004, and the lowest - 0 in 2009. The data has a rising trend.
The average number of deaths per 1,000 fire incidents is 1. This indicator was the highest - 3 in 2005, and the lowest 0 in 2009. The trend for deaths per 1,000 fire incidents is increasing. Compared to the Missouri value the number of deaths per 1,000 incidents is much lower.
Based on the reports from the years 2002 - 2011 the average number of fire-related yearly deaths is 3. The highest number of deaths - 7 took place in 2004, and the lowest - 0 in 2009. The data has a rising trend.
The average number of deaths per 1,000 fire incidents is 1. This indicator was the highest - 3 in 2005, and the lowest 0 in 2009. The trend for deaths per 1,000 fire incidents is increasing. Compared to the Missouri value the number of deaths per 1,000 incidents is much lower.Deaths per 1,000 incidents in St. Louis, MO compared to nearest cities:
(Note: Based on data for all years, including only cities with at least 2,500 fire incidents)
| St. Louis: | 0.8 |
| Cahokia: | 3.1 |
| Granite City: | 2.0 |
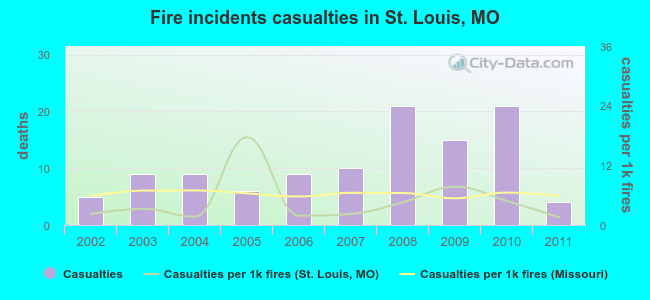 According to the data from the years 2002 - 2011 the average number of fire-related casualties per year is 11. The highest number of casualties - 21 took place in 2008, and the lowest - 4 in 2011. The data has a declining trend.
The average number of injuries per 1,000 fire incidents is 5. This indicator was the highest - 18 in 2005, and the lowest 2 in 2011. The trend for casualties per 1,000 fire incidents is dropping. Compared to the Missouri value the number of casualties per 1,000 fire incidents is lower.
According to the data from the years 2002 - 2011 the average number of fire-related casualties per year is 11. The highest number of casualties - 21 took place in 2008, and the lowest - 4 in 2011. The data has a declining trend.
The average number of injuries per 1,000 fire incidents is 5. This indicator was the highest - 18 in 2005, and the lowest 2 in 2011. The trend for casualties per 1,000 fire incidents is dropping. Compared to the Missouri value the number of casualties per 1,000 fire incidents is lower.Casualties per 1,000 incidents in St. Louis, MO compared to nearest cities:
(Note: Based on data for all years, including only cities with at least 500 fire incidents)
| St. Louis: | 3.3 |
| Maplewood: | 13.3 |
| Richmond Heights: | 1.9 |
| Clayton: | 6.0 |
| University City: | 5.5 |
| Shrewsbury: | 5.7 |
| Brentwood: | 1.4 |
| Cahokia: | 9.4 |
| East St. Louis: | 2.3 |
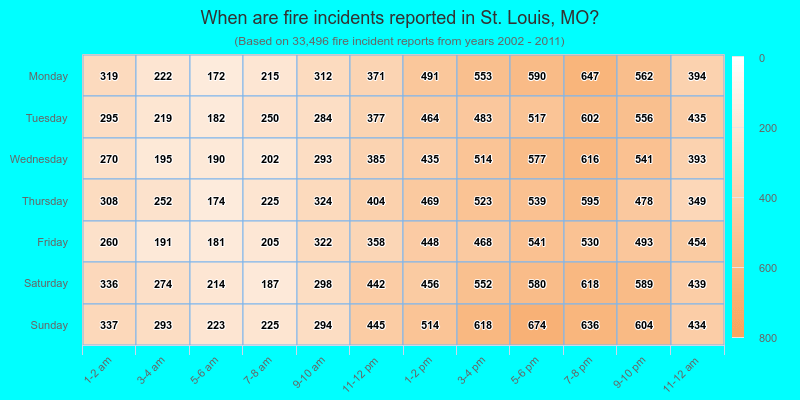
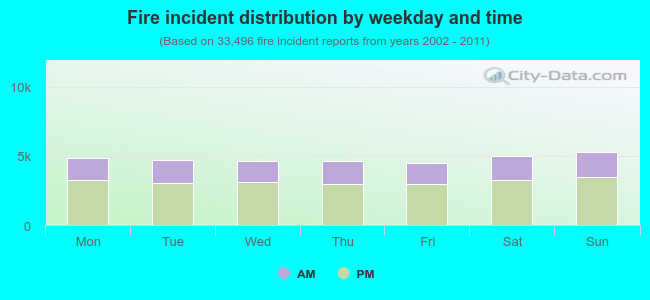 34.4% incidents where reported in the morning and 65.6% in the evening. The most fires (15.8%) took place on Sunday, and the least (13.3%) on Friday.
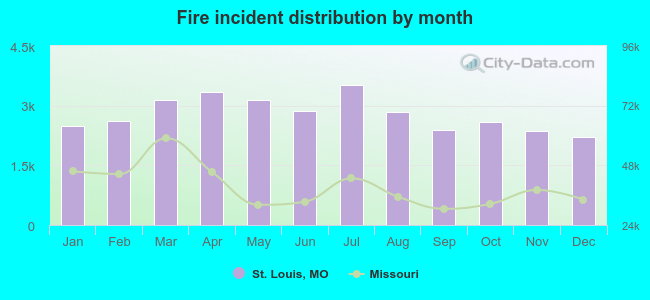 According to the 33,496 incident reports from years 2002 - 2011 most fires (10.5%) took place during July, and the least (6.6%) in December.
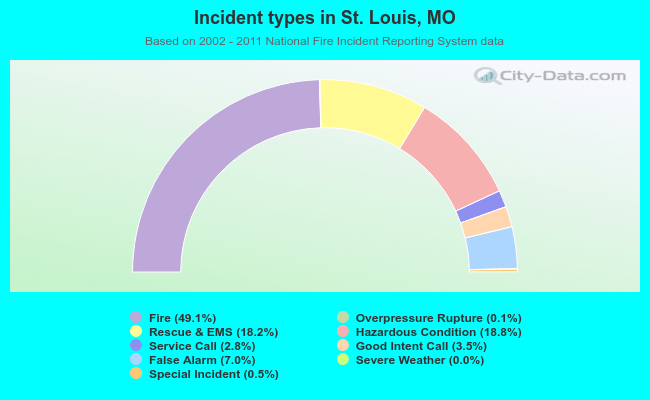 Out of all 68,231 cases reported during the years 2002 - 2011, the most belonged to the categories: Fire (49.1%), Hazardous Condition (18.8%), and Rescue & EMS (18.2%).
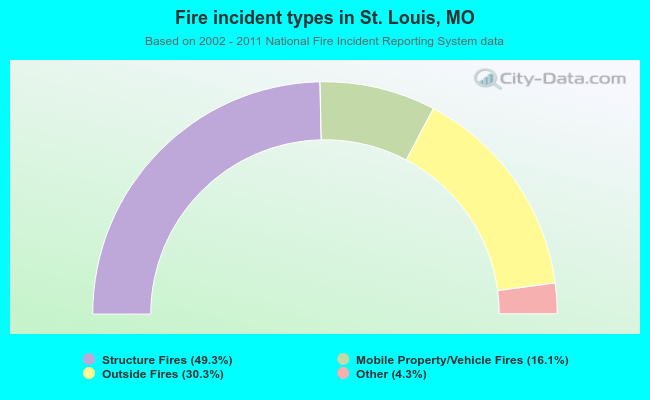 When looking into fire subcategories, the most incidents belonged to: Structure Fires (49.3%), and Outside Fires (30.3%).