Maplewood: Fire Incidents, Missouri (MO)
Where are fire incidents reported in Maplewood, MO
Something went wrong! Please refresh the page.
| Fire incidents reported | |
|---|---|
| Sreet name | Count |
| MANCHESTER RD | 164 |
| YALE AVE | 128 |
| BIG BEND BLVD | 122 |
| BELLEVUE AVE | 118 |
| LACLEDE STATION RD | 102 |
| LYNDOVER PL | 76 |
| ANNA AVE | 74 |
| SUTTON BLVD | 66 |
| MANCHESTER | 54 |
| FLORA AVE | 50 |
| MAPLEWOOD COMMONS DR | 44 |
| CAMBRIDGE AVE | 40 |
| LOHMEYER AVE | 38 |
| GREENWOOD BLVD | 34 |
| SOUTHWEST AVE | 34 |
| ZEPHYR PL | 34 |
| BELLEVUE | 32 |
| YALE | 32 |
| ANNA | 30 |
| COMMONWEALTH AVE | 24 |
| FOLK AVE | 24 |
| LYNDOVER | 24 |
| BIG BEND | 22 |
| HANLEY RD | 22 |
| MANCHESTER AVE | 22 |
| MAPLE AVE | 22 |
| ROSELAND TER | 22 |
| BARTOLD AVE | 20 |
| OXFORD BLVD | 20 |
| SUNNEN DR | 20 |
2002 - 2018 National Fire Incident Reporting System (NFIRS) incidents
- Incident types reported to NFIRS in Maplewood, MO
- 3,02139.8%Rescue & EMS
- 1,37818.2%Hazardous Condition
- 1,27516.8%Fire
- 88311.6%Good Intent Call
- 80710.6%False Alarm
- 1792.4%Service Call
- 200.3%Overpressure Rupture
- 140.2%Special Incident
- Fire incident types reported to NFIRS in Maplewood, MO
- 80363.0%Structure Fires
- 20416.0%Outside Fires
- 16613.0%Other
- 1028.0%Mobile Property/Vehicle Fires
 According to the data from the years 2002 - 2018 the average number of fires per year is 75. The highest number of fires - 139 took place in 2004, and the least - 32 in 2018. The data has a decreasing trend.
The average number of yearly fire incidents per 10k residents in Maplewood, MO compared to nearest cities:
(Note: Based on data for the last 3 years, including only cities with population 5,000 and above)
| Maplewood: | 75.0 |
| Richmond Heights: | 78.9 |
| Brentwood: | 51.4 |
| Shrewsbury: | 28.5 |
| Clayton: | 43.4 |
| Webster Groves: | 24.9 |
| University City: | 47.4 |
| Glendale: | 11.3 |
| Ladue: | 48.2 |
 The median response time based on all reported fire incidents is 4 minutes. This is lower than the Missouri median value.
The median response time in Maplewood, MO compared to nearest cities:
(Note: Based on data for all years, including only cities with at least 500 fire incidents)
| Maplewood: | 4 minutes |
| Richmond Heights: | 5 minutes |
| Brentwood: | 4 minutes |
| Shrewsbury: | 5 minutes |
| Clayton: | 4 minutes |
| Webster Groves: | 5 minutes |
| University City: | 5 minutes |
| Ladue: | 6 minutes |
| Affton: | 5 minutes |
 Based on the reports from the years 2002 - 2018 the average number of fire-related casualties per year is 1. The highest number of reported injuries - 9 took place in 2004, and the lowest - 0 in 2002. The data has a constant trend.
The average number of casualties per 1,000 fire incidents is 9. This indicator was the highest - 65 in 2004, and the lowest 0 in 2002. The trend for casualties per 1,000 fires is constant. Compared to the state value the number of injuries per 1,000 fires is much higher.
Based on the reports from the years 2002 - 2018 the average number of fire-related casualties per year is 1. The highest number of reported injuries - 9 took place in 2004, and the lowest - 0 in 2002. The data has a constant trend.
The average number of casualties per 1,000 fire incidents is 9. This indicator was the highest - 65 in 2004, and the lowest 0 in 2002. The trend for casualties per 1,000 fires is constant. Compared to the state value the number of injuries per 1,000 fires is much higher.Casualties per 1,000 incidents in Maplewood, MO compared to nearest cities:
(Note: Based on data for all years, including only cities with at least 500 fire incidents)
| Maplewood: | 13.3 |
| Richmond Heights: | 1.9 |
| Brentwood: | 1.4 |
| Shrewsbury: | 5.7 |
| Clayton: | 6.0 |
| Webster Groves: | 1.2 |
| University City: | 5.5 |
| Ladue: | 1.7 |
| Affton: | 1.1 |
 39.6% incidents where reported in the morning and 60.4% in the evening. The most fires (16.3%) took place on Saturday, and the least (12.4%) on Sunday.
 According to the 1,275 incident reports from years 2002 - 2018 most fires (10.4%) took place during March, and the least (6.4%) in October.
 Out of all 7,583 cases reported during the years 2002 - 2018, the most belonged to the categories: Rescue & EMS (39.8%), Hazardous Condition (18.2%), and Fire (16.8%).
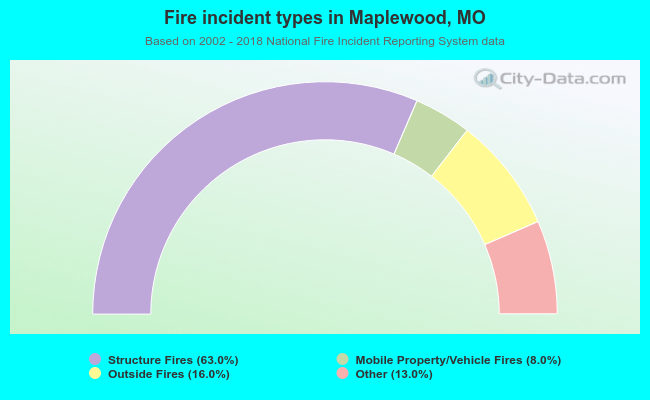 When looking into fire subcategories, the most incidents belonged to: Structure Fires (63.0%), and Outside Fires (16.0%).