Springfield: Fire Incidents, Tennessee (TN)
Where are fire incidents reported in Springfield, TN
Something went wrong! Please refresh the page.
| Fire incidents reported | |
|---|---|
| Sreet name | Count |
| MEMORIAL BLVD | 206 |
| MAIN ST | 158 |
| TOM AUSTIN HWY | 132 |
| OWENS CHAPEL RD | 60 |
| INDUSTRIAL DR | 52 |
| 5TH AVE | 48 |
| HIGHWAY 41 | 48 |
| 5TH | 46 |
| MEMORIAL | 46 |
| 49 HWY | 44 |
| BILL JONES INDUSTRIAL DR | 44 |
| WESTGATE DR | 44 |
| LAHR RD | 40 |
| NEW CHAPEL RD | 40 |
| CHEATHAM ST | 36 |
| COUNTY ROAD | 36 |
| ELMWOOD DR | 34 |
| 16TH AVE | 30 |
| 17TH AVE | 30 |
| 8TH AVE | 30 |
| BRANSFORD DR | 30 |
| HWY 49 HWY | 30 |
| 10TH AVE | 28 |
| 15TH AVE | 28 |
| 17TH | 28 |
| BURR RD | 28 |
| 16TH | 26 |
| 22ND AVE | 26 |
| BLACKPATCH DR | 26 |
| CARDEN CIR | 26 |
| Other | 967 |
2002 - 2018 National Fire Incident Reporting System (NFIRS) incidents
- Incident types reported to NFIRS in Springfield, TN
- 10,52657.9%Rescue & EMS
- 2,44713.5%Fire
- 1,6038.8%Hazardous Condition
- 1,3747.6%False Alarm
- 1,0275.6%Good Intent Call
- 8764.8%Service Call
- 2231.2%Special Incident
- 840.5%Severe Weather
- Fire incident types reported to NFIRS in Springfield, TN
- 1,10745.2%Outside Fires
- 82133.6%Structure Fires
- 37815.4%Mobile Property/Vehicle Fires
- 1415.8%Other
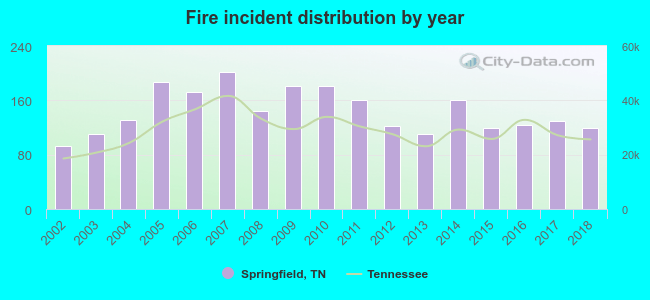 According to the data from the years 2002 - 2018 the average number of fires per year is 144. The highest number of fires - 201 took place in 2007, and the least - 93 in 2002. The data has an increasing trend.
The average number of yearly fire incidents per 10k residents in Springfield, TN compared to nearest cities:
(Note: Based on data for the last 3 years, including only cities with population 5,000 and above)
| Springfield: | 74.2 |
| Greenbrier: | 112.2 |
| Millersville: | 28.0 |
| White House: | 48.0 |
| Goodlettsville: | 52.6 |
| Hendersonville: | 16.0 |
| Portland: | 62.7 |
| Gallatin: | 36.3 |
| Clarksville: | 41.0 |
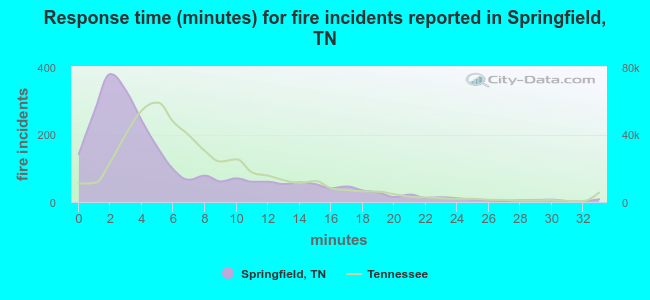 The median response time based on all reported fire incidents is 4 minutes. This is lower compared to the Tennessee median value.
The median response time in Springfield, TN compared to nearest cities:
(Note: Based on data for all years, including only cities with at least 500 fire incidents)
| Springfield: | 4 minutes |
| Greenbrier: | 8 minutes |
| White House: | 6 minutes |
| Goodlettsville: | 4 minutes |
| Ashland City: | 10 minutes |
| Hendersonville: | 5 minutes |
| Portland: | 9 minutes |
| Franklin: | 8 minutes |
| Russellville: | 5 minutes |
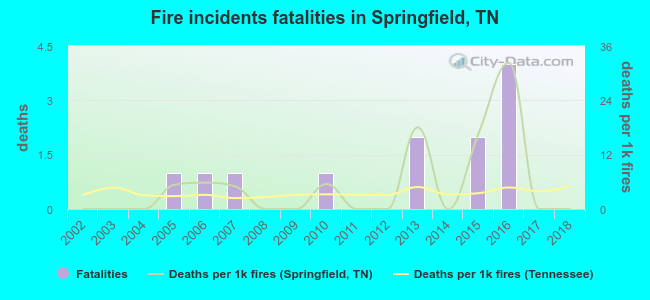 According to the data from the years 2002 - 2018 the average number of fire-related yearly deaths is 1. The highest number of deaths - 4 took place in 2016, and the lowest - 0 in 2002. The data has a constant trend.
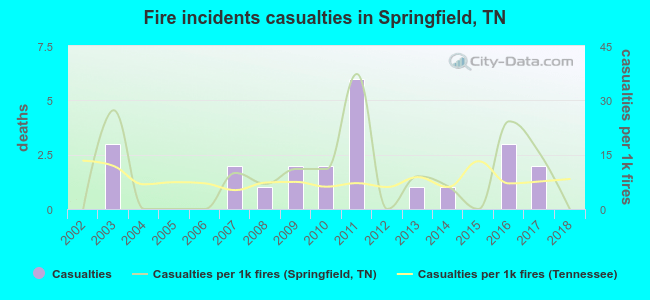 According to the data from the years 2002 - 2018 the average number of fire-related yearly casualties is 1. The highest number of injuries - 6 took place in 2011, and the lowest - 0 in 2002. The data has a constant trend.
The average number of casualties per 1,000 fire incidents is 9. This indicator was the highest - 37 in 2011, and the lowest 0 in 2002. The trend for casualties per 1,000 fires is constant. Compared to the state value the number of casualties per 1,000 fires is higher.
According to the data from the years 2002 - 2018 the average number of fire-related yearly casualties is 1. The highest number of injuries - 6 took place in 2011, and the lowest - 0 in 2002. The data has a constant trend.
The average number of casualties per 1,000 fire incidents is 9. This indicator was the highest - 37 in 2011, and the lowest 0 in 2002. The trend for casualties per 1,000 fires is constant. Compared to the state value the number of casualties per 1,000 fires is higher.Casualties per 1,000 incidents in Springfield, TN compared to nearest cities:
(Note: Based on data for all years, including only cities with at least 500 fire incidents)
| Springfield: | 9.4 |
| Greenbrier: | 9.7 |
| White House: | 2.4 |
| Goodlettsville: | 7.5 |
| Ashland City: | 6.7 |
| Hendersonville: | 30.0 |
| Portland: | 0.6 |
| Franklin: | 5.6 |
| Russellville: | 1.0 |
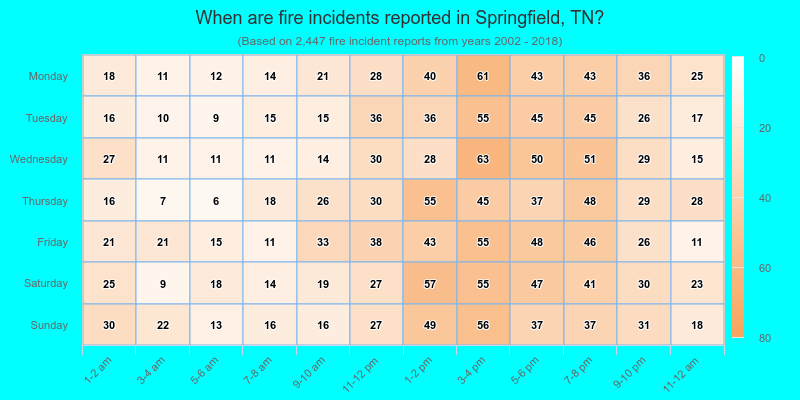
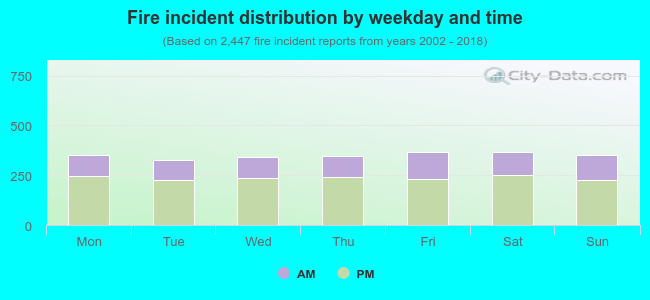 32.2% incidents where reported in the morning and 67.8% in the evening. The most fires (15.0%) took place on Friday, and the least (13.3%) on Tuesday.
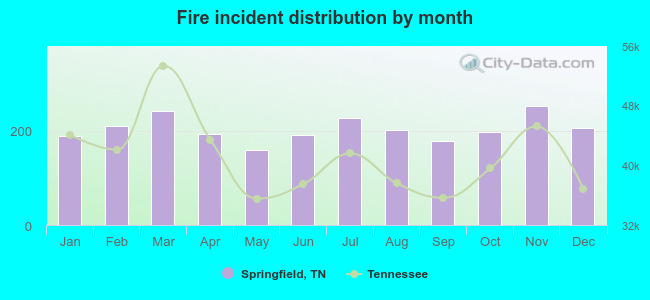 According to the 2,447 reports from years 2002 - 2018 most fires (10.3%) took place during November, and the least (6.5%) in May.
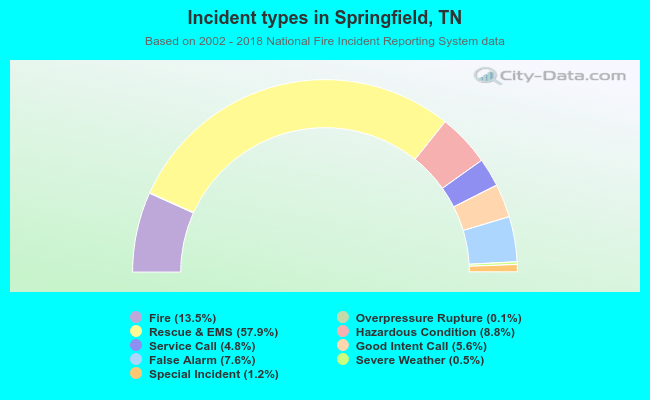 Out of all 18,178 cases reported during the years 2002 - 2018, the most belonged to the categories: Rescue & EMS (57.9%), Fire (13.5%), and Hazardous Condition (8.8%).
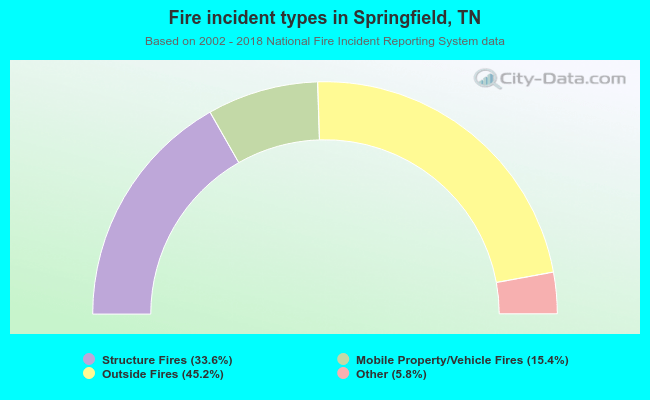 When looking into fire subcategories, the most incidents belonged to: Outside Fires (45.2%), and Structure Fires (33.6%).