Portland: Fire Incidents, Tennessee (TN)
Where are fire incidents reported in Portland, TN
Something went wrong! Please refresh the page.
| Fire incidents reported | |
|---|---|
| Sreet name | Count |
| BROADWAY | 162 |
| HIGHWAY 52 | 110 |
| RUSSELL ST | 88 |
| KIRBY RD | 52 |
| COLLEGE ST | 44 |
| FOWLER FORD RD | 44 |
| BRANDY HOLLOW RD | 36 |
| HIGHLAND RD | 36 |
| HIGHWAY 259 | 36 |
| OLD GALLATIN RD | 36 |
| PAYNE RD | 36 |
| PORTLAND BLVD | 36 |
| HIGHWAY 109 | 34 |
| HIGHWAY 31 | 32 |
| SCATTERSVILLE RD | 32 |
| BUTLER RD | 30 |
| HWY 76 | 30 |
| LAKE SPRINGS RD | 28 |
| MARKET ST | 28 |
| NEW DEAL POTTS RD | 26 |
| CORINTH RD | 24 |
| DENNING FORD RD | 22 |
| DORRIS RD | 22 |
| HWY 109 N | 22 |
| STRAWBERRY ST | 22 |
| TGT RD | 22 |
| HIGHWAY 31W | 20 |
| DOBBINS PIKE | 18 |
| HIGHWAY 76 | 18 |
| HWY 109 | 18 |
| Other | 621 |
2002 - 2018 National Fire Incident Reporting System (NFIRS) incidents
- Incident types reported to NFIRS in Portland, TN
- 6,50261.7%Rescue & EMS
- 1,78516.9%Fire
- 8688.2%Good Intent Call
- 5485.2%Hazardous Condition
- 4494.3%False Alarm
- 3323.2%Service Call
- 250.2%Special Incident
- 210.2%Severe Weather
- Fire incident types reported to NFIRS in Portland, TN
- 80545.1%Outside Fires
- 67337.7%Structure Fires
- 22212.4%Mobile Property/Vehicle Fires
- 854.8%Other
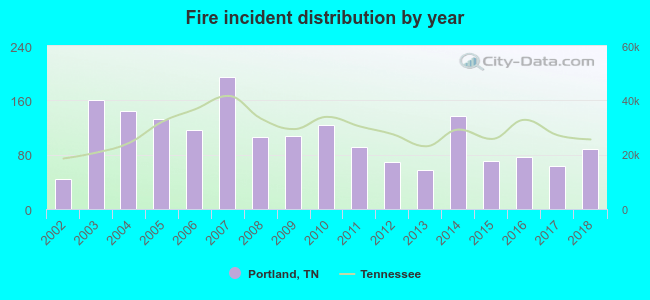 Based on the data from the years 2002 - 2018 the average number of fires per year is 105. The highest number of fire incidents - 195 took place in 2007, and the least - 44 in 2002. The data has an increasing trend.
The average number of yearly fire incidents per 10k residents in Portland, TN compared to nearest cities:
(Note: Based on data for the last 3 years, including only cities with population 5,000 and above)
| Portland: | 62.7 |
| White House: | 48.0 |
| Gallatin: | 36.3 |
| Castalian Springs: | 25.4 |
| Millersville: | 28.0 |
| Greenbrier: | 112.2 |
| Hendersonville: | 16.0 |
| Goodlettsville: | 52.6 |
| Springfield: | 74.2 |
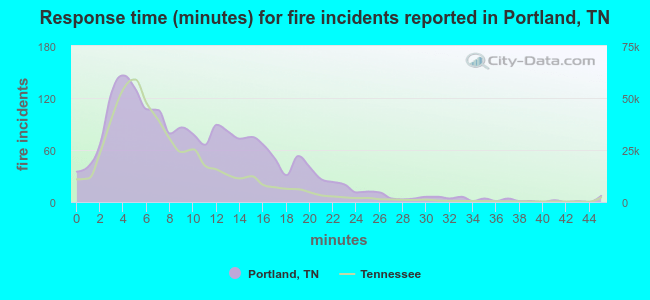 The median response time based on all reported fire incidents is 9 minutes. This is higher compared to the state median value.
The median response time in Portland, TN compared to nearest cities:
(Note: Based on data for all years, including only cities with at least 500 fire incidents)
| Portland: | 9 minutes |
| Franklin: | 8 minutes |
| White House: | 6 minutes |
| Gallatin: | 5 minutes |
| Westmoreland: | 11 minutes |
| Greenbrier: | 8 minutes |
| Hendersonville: | 5 minutes |
| Goodlettsville: | 4 minutes |
| Springfield: | 4 minutes |
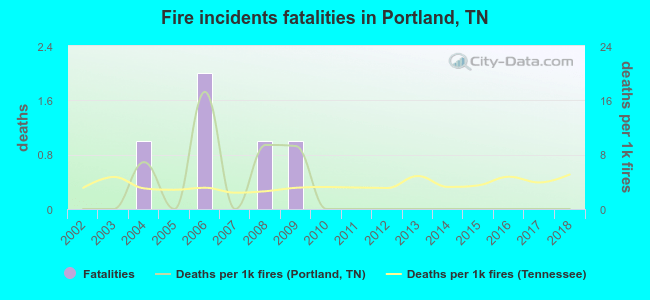 Based on the data from the years 2002 - 2018 the average number of fire-related yearly deaths is 0. The highest number of reported deaths - 2 took place in 2006, and the lowest - 0 in 2002. The data has a constant trend.
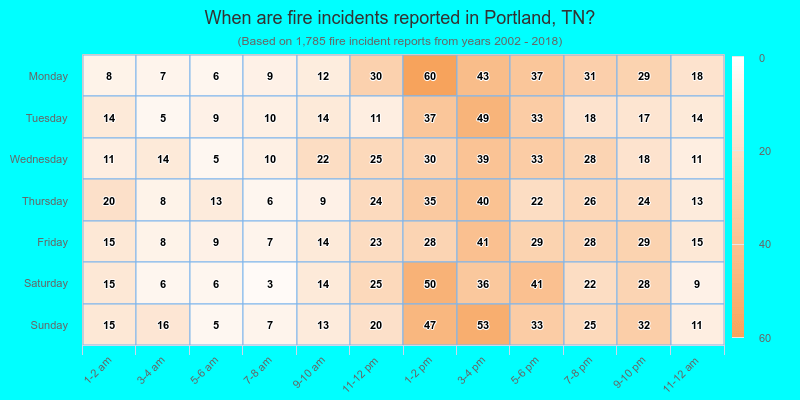
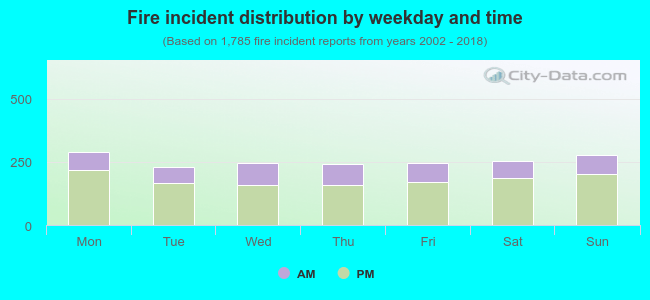 29.3% incidents where reported in the morning and 70.7% in the evening. The most fires (16.2%) took place on Monday, and the least (12.9%) on Tuesday.
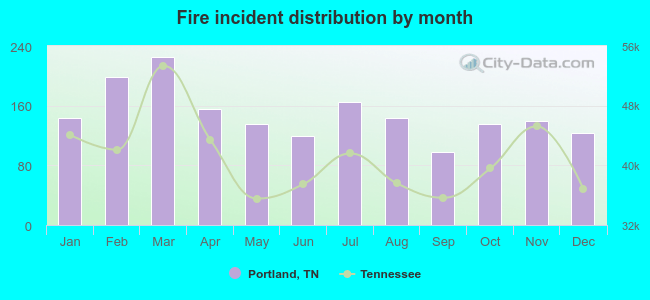 Based on the 1,785 fire incident reports from years 2002 - 2018 most fires (12.6%) took place during March, and the least (5.5%) in September.
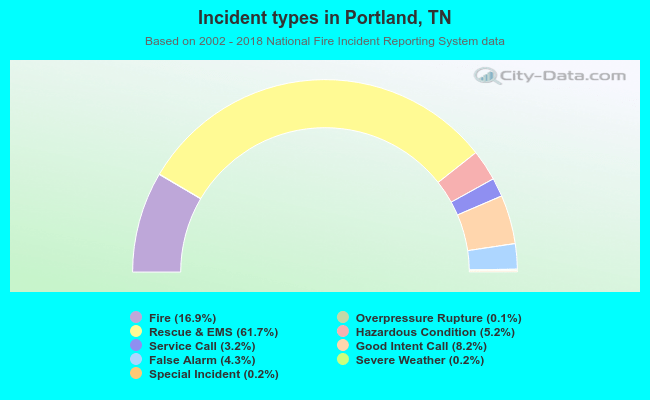 Out of all 10,539 cases reported during the years 2002 - 2018, the most belonged to the categories: Rescue & EMS (61.7%), Fire (16.9%), and Good Intent Call (8.2%).
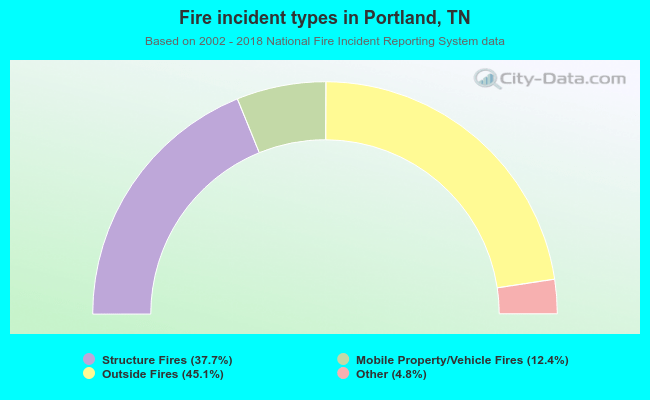 When looking into fire subcategories, the most incidents belonged to: Outside Fires (45.1%), and Structure Fires (37.7%).