Southern Pines: Fire Incidents, North Carolina (NC)
Where are fire incidents reported in Southern Pines, NC
Something went wrong! Please refresh the page.
| Fire incidents reported | |
|---|---|
| Sreet name | Count |
| MIDLAND RD | 120 |
| MORGANTON RD | 96 |
| RICHARDS ST | 82 |
| MURRAY HILL RD | 78 |
| YOUNGS RD | 64 |
| US 1 HWY | 62 |
| MAY ST | 60 |
| US15501 HWY | 60 |
| BRUCEWOOD RD | 58 |
| COATS ST | 56 |
| BROAD ST | 52 |
| GAINES ST | 52 |
| MECHANICS ST | 48 |
| SHAW AVE | 42 |
| TALMADGE WAY | 42 |
| PENNSYLVANIA AV | 40 |
| US1 HWY | 40 |
| US HWY 15-501 | 36 |
| FIRE LN | 34 |
| US HWY 1 N | 34 |
| INDIANA AV | 32 |
| US15-501 HWY | 32 |
| WAYNOR RD | 32 |
| CENTRAL DR | 30 |
| SHAW AV | 30 |
| AIRPORT RD | 28 |
| E. RHODE ISLAND AVE. EXT | 28 |
| PEE DEE RD | 28 |
| US HWY 1 S | 28 |
| YADKIN RD | 28 |
| Other | 657 |
2002 - 2018 National Fire Incident Reporting System (NFIRS) incidents
- Incident types reported to NFIRS in Southern Pines, NC
- 4,25936.8%Rescue & EMS
- 2,10918.2%Fire
- 1,82115.7%False Alarm
- 1,18310.2%Good Intent Call
- 1,1509.9%Hazardous Condition
- 7076.1%Service Call
- 3382.9%Severe Weather
- Fire incident types reported to NFIRS in Southern Pines, NC
- 1,07050.7%Structure Fires
- 81138.5%Outside Fires
- 2099.9%Mobile Property/Vehicle Fires
- 190.9%Other
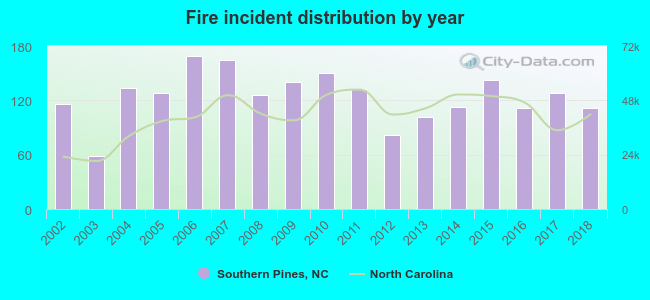 Based on the data from the years 2002 - 2018 the average number of fires per year is 124. The highest number of fire incidents - 169 took place in 2006, and the least - 59 in 2003. The data has a decreasing trend.
The average number of yearly fire incidents per 10k residents in Southern Pines, NC compared to nearest cities:
(Note: Based on data for the last 3 years, including only cities with population 5,000 and above)
| Southern Pines: | 88.4 |
| Aberdeen: | 178.1 |
| Pinehurst: | 47.3 |
| Fort Bragg: | 0.3 |
| Spring Lake: | 144.1 |
| Sanford: | 128.7 |
| Rockingham: | 119.3 |
| Hamlet: | 85.0 |
| Fayetteville: | 65.8 |
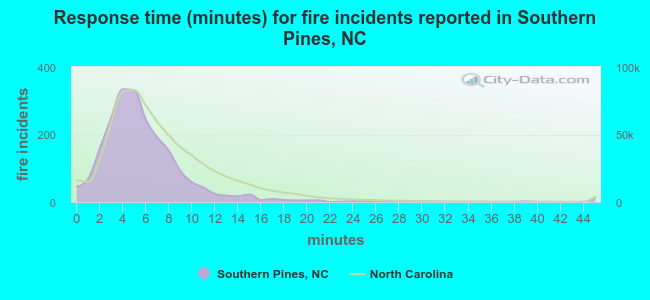 The median response time based on all reported fire incidents is 5 minutes. This is lower than the state median value.
The median response time in Southern Pines, NC compared to nearest cities:
(Note: Based on data for all years, including only cities with at least 500 fire incidents)
| Southern Pines: | 5 minutes |
| Aberdeen: | 5 minutes |
| Pinehurst: | 6 minutes |
| Pinebluff: | 8 minutes |
| Vass: | 7 minutes |
| Carthage: | 9 minutes |
| Cameron: | 8 minutes |
| Raeford: | 8 minutes |
| Robbins: | 9 minutes |
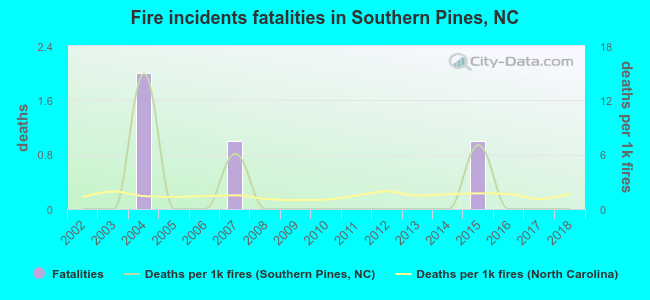 Based on the reports from the years 2002 - 2018 the average number of fire-related yearly deaths is 0. The highest number of reported deaths - 2 took place in 2004, and the lowest - 0 in 2002. The data has a constant trend.
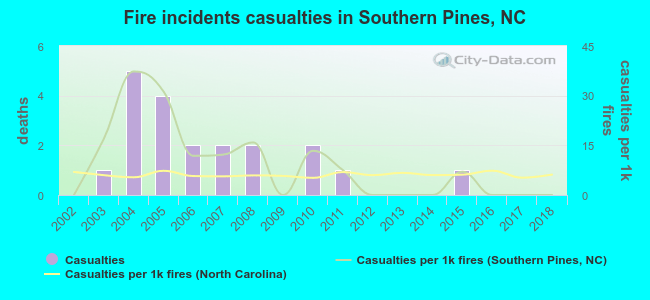 According to the reports from the years 2002 - 2018 the average number of fire-related casualties per year is 1. The highest number of injuries - 5 took place in 2004, and the lowest - 0 in 2002. The data has a constant trend.
The average number of injuries per 1,000 fire incidents is 9. This indicator was the highest - 37 in 2004, and the lowest 0 in 2002. The trend for injuries per 1,000 fires is increasing. Compared to the state value the number of casualties per 1,000 fire incidents is higher.
According to the reports from the years 2002 - 2018 the average number of fire-related casualties per year is 1. The highest number of injuries - 5 took place in 2004, and the lowest - 0 in 2002. The data has a constant trend.
The average number of injuries per 1,000 fire incidents is 9. This indicator was the highest - 37 in 2004, and the lowest 0 in 2002. The trend for injuries per 1,000 fires is increasing. Compared to the state value the number of casualties per 1,000 fire incidents is higher.
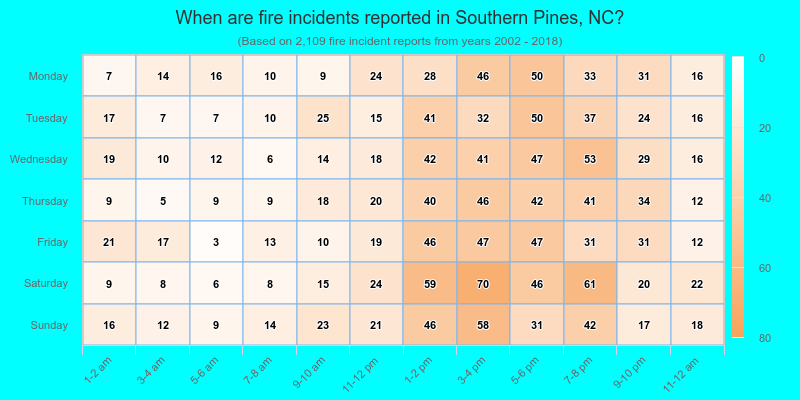
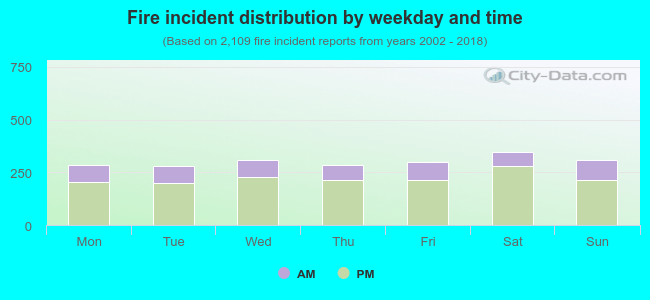 26.5% incidents where reported in the morning and 73.5% in the evening. The most fires (16.5%) took place on Saturday, and the least (13.3%) on Tuesday.
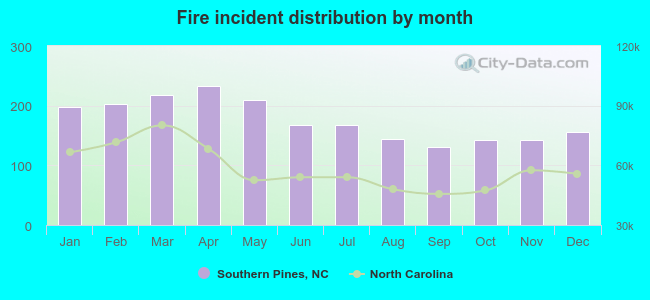 Based on the 2,109 fire incident reports from years 2002 - 2018 most fires (11.0%) took place during April, and the least (6.2%) in September.
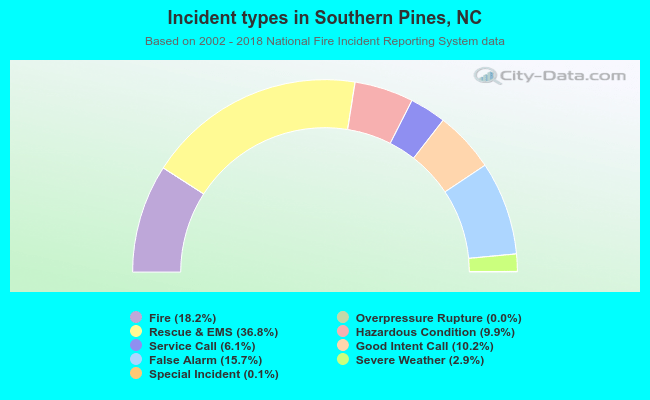 Out of all 11,576 cases reported during the years 2002 - 2018, the most belonged to the categories: Rescue & EMS (36.8%), Fire (18.2%), and False Alarm (15.7%).
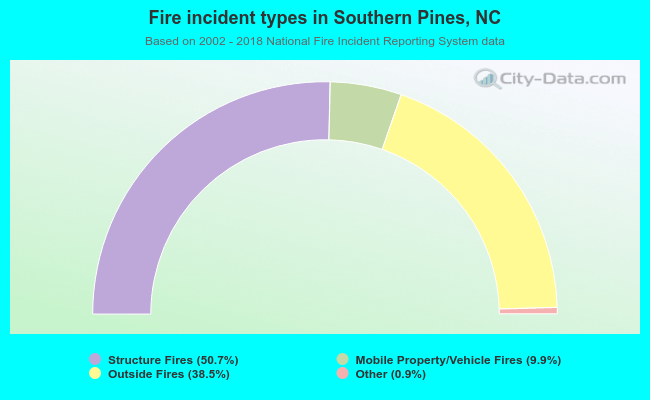 When looking into fire subcategories, the most incidents belonged to: Structure Fires (50.7%), and Outside Fires (38.5%).