Robbins: Fire Incidents, North Carolina (NC)
Where are fire incidents reported in Robbins, NC
Something went wrong! Please refresh the page.
|
| |||||||||||||||||||||||||||||||||||||||||||||||||||||||||||||||||||||||||||||||||||||||||||||||||||||||||||||
2005 - 2018 National Fire Incident Reporting System (NFIRS) incidents
- Incident types reported to NFIRS in Robbins, NC
- 1,62840.1%Rescue & EMS
- 1,01725.1%Fire
- 61415.1%Good Intent Call
- 2606.4%Severe Weather
- 2446.0%Hazardous Condition
- 1674.1%False Alarm
- 1243.1%Service Call
- Fire incident types reported to NFIRS in Robbins, NC
- 58357.3%Structure Fires
- 33432.8%Outside Fires
- 747.3%Mobile Property/Vehicle Fires
- 262.6%Other
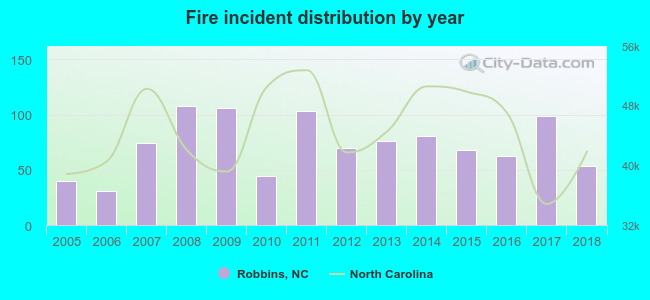 Based on the data from the years 2005 - 2018 the average number of fires per year is 73. The highest number of fire incidents - 108 took place in 2008, and the least - 31 in 2006. The data has a growing trend.
 The median response time based on all reported fire incidents is 9 minutes. This is higher than the North Carolina median value.
The median response time in Robbins, NC compared to nearest cities:
(Note: Based on data for all years, including only cities with at least 500 fire incidents)
| Robbins: | 9 minutes |
| Carthage: | 9 minutes |
| Seagrove: | 10 minutes |
| Pinehurst: | 6 minutes |
| Troy: | 7 minutes |
| Cameron: | 8 minutes |
| Southern Pines: | 5 minutes |
| Vass: | 7 minutes |
| Ramseur: | 7 minutes |
 33.3% incidents where reported in the morning and 66.7% in the evening. The most fires (17.5%) took place on Sunday, and the least (11.8%) on Wednesday.
 According to the 1,017 reports from years 2005 - 2018 most fires (13.2%) took place during February, and the least (3.9%) in May.
 Out of all 4,059 cases reported during the years 2005 - 2018, the most belonged to the categories: Rescue & EMS (40.1%), Fire (25.1%), and Good Intent Call (15.1%).
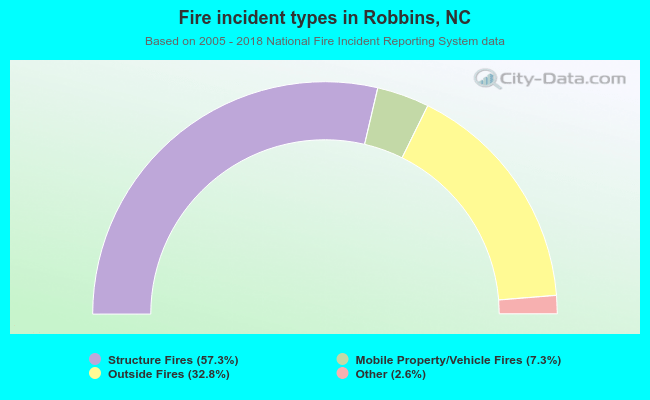 When looking into fire subcategories, the most incidents belonged to: Structure Fires (57.3%), and Outside Fires (32.8%).