South Jordan: Fire Incidents, Utah (UT)
Where are fire incidents reported in South Jordan, UT
Something went wrong! Please refresh the page.
| Fire incidents reported | |
|---|---|
| Sreet name | Count |
| REDWOOD RD | 128 |
| BANGERTER HWY | 98 |
| SOUTH JORDAN PKY | 86 |
| 11400 ST | 44 |
| JORDAN GATEWAY BLVD | 38 |
| 1300 ST | 36 |
| 2700 ST | 36 |
| 2200 ST | 30 |
| YORKSHIRE DR | 28 |
| 4000 ST | 26 |
| 1300 | 24 |
| 9800 | 24 |
| 3200 ST | 22 |
| PARKWAY PLAZA DR | 22 |
| SKYE DR | 20 |
| 10400 ST | 18 |
| DUNSINANE DR | 18 |
| PENDLETON WAY | 18 |
| RIVER FRONT PKY | 18 |
| 10200 ST | 16 |
| 11800 ST | 16 |
| 9800 ST | 16 |
| CADBURY DR | 16 |
| U-111 HWY | 16 |
| LAMPTON VIEW DR | 14 |
| 2700 | 12 |
| 2950 | 12 |
| DISTRICT DR | 12 |
| 1000 ST | 10 |
| 10000 ST | 10 |
| Other | 400 |
2002 - 2018 National Fire Incident Reporting System (NFIRS) incidents
- Incident types reported to NFIRS in South Jordan, UT
- 1,28424.2%Fire
- 1,15121.7%False Alarm
- 94717.9%Hazardous Condition
- 89016.8%Good Intent Call
- 75414.2%Service Call
- 2164.1%Rescue & EMS
- 330.6%Severe Weather
- 160.3%Overpressure Rupture
- 130.2%Special Incident
- Fire incident types reported to NFIRS in South Jordan, UT
- 49438.5%Outside Fires
- 48637.9%Structure Fires
- 17213.4%Mobile Property/Vehicle Fires
- 13210.3%Other
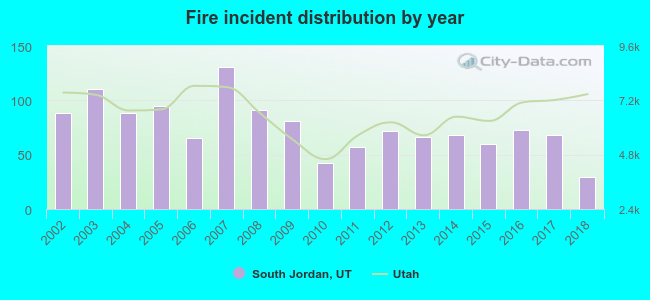 Based on the data from the years 2002 - 2018 the average number of fires per year is 76. The highest number of reported fire incidents - 131 took place in 2007, and the least - 29 in 2018. The data has a decreasing trend.
The average number of yearly fire incidents per 10k residents in South Jordan, UT compared to nearest cities:
(Note: Based on data for the last 3 years, including only cities with population 5,000 and above)
| South Jordan: | 9.0 |
| Riverton: | 10.3 |
| West Jordan: | 11.0 |
| Midvale: | 27.1 |
| Herriman: | 16.2 |
| Sandy: | 2.3 |
| Draper: | 16.0 |
| Bluffdale: | 21.2 |
| Taylorsville: | 20.8 |
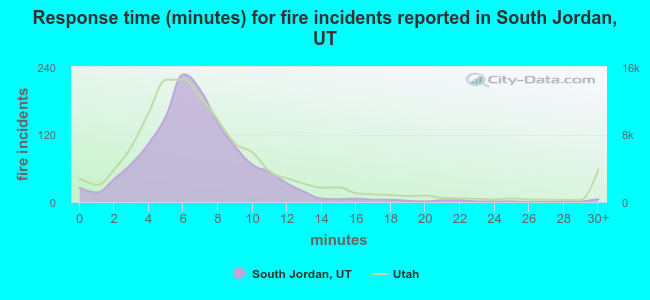 The median response time based on all reported fire incidents is 7 minutes. This is comparable to the Utah median value.
The median response time in South Jordan, UT compared to nearest cities:
(Note: Based on data for all years, including only cities with at least 500 fire incidents)
| South Jordan: | 7 minutes |
| Riverton: | 7 minutes |
| West Jordan: | 6 minutes |
| Midvale: | 6 minutes |
| Sandy: | 6 minutes |
| Draper: | 8 minutes |
| Taylorsville: | 7 minutes |
| Kearns: | 7 minutes |
| Murray: | 6 minutes |
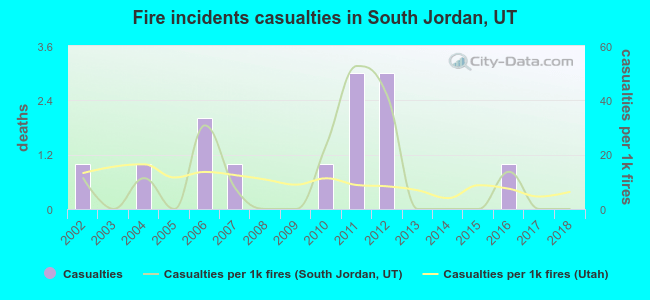 According to the data from the years 2002 - 2018 the average number of fire-related yearly casualties is 1. The highest number of injuries - 3 took place in 2011, and the lowest - 0 in 2003. The data has a declining trend.
The average number of injuries per 1,000 fires is 11. This indicator was the highest - 53 in 2011, and the lowest 0 in 2003. The trend for injuries per 1,000 fires is declining. Compared to the state value the number of casualties per 1,000 fires is similar.
According to the data from the years 2002 - 2018 the average number of fire-related yearly casualties is 1. The highest number of injuries - 3 took place in 2011, and the lowest - 0 in 2003. The data has a declining trend.
The average number of injuries per 1,000 fires is 11. This indicator was the highest - 53 in 2011, and the lowest 0 in 2003. The trend for injuries per 1,000 fires is declining. Compared to the state value the number of casualties per 1,000 fires is similar.Casualties per 1,000 incidents in South Jordan, UT compared to nearest cities:
(Note: Based on data for all years, including only cities with at least 500 fire incidents)
| South Jordan: | 10.1 |
| Riverton: | 5.4 |
| West Jordan: | 14.4 |
| Midvale: | 13.4 |
| Sandy: | 23.3 |
| Draper: | 3.2 |
| Taylorsville: | 8.6 |
| Kearns: | 13.4 |
| Murray: | 5.4 |
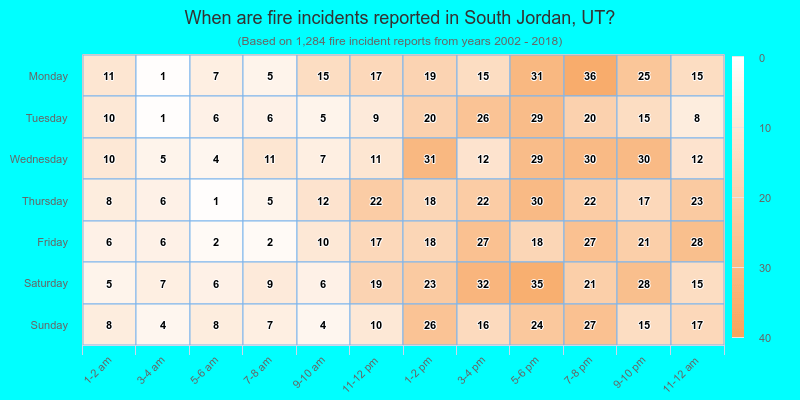
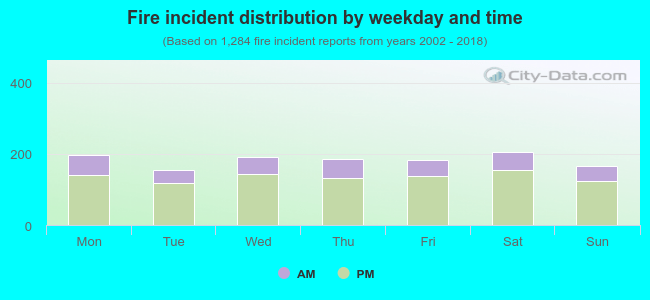 25.8% incidents where reported in the morning and 74.2% in the evening. The most fires (16.0%) took place on Saturday, and the least (12.1%) on Tuesday.
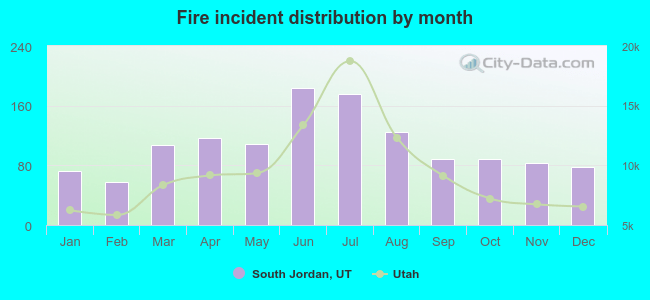 According to the 1,284 fire incidents from years 2002 - 2018 most fires (14.3%) took place during June, and the least (4.5%) in February.
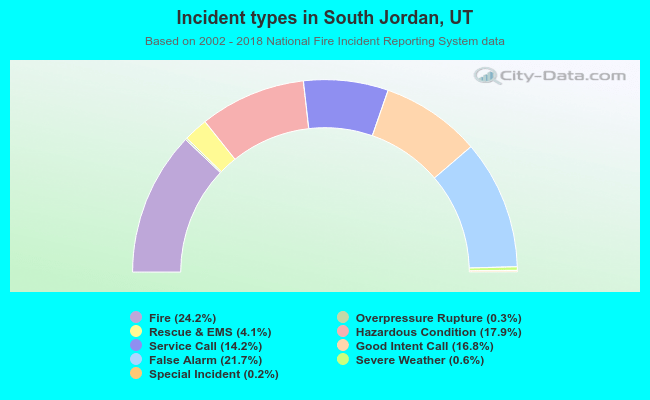 Out of all 5,304 cases reported during the years 2002 - 2018, the most belonged to the categories: Fire (24.2%), False Alarm (21.7%), and Hazardous Condition (17.9%).
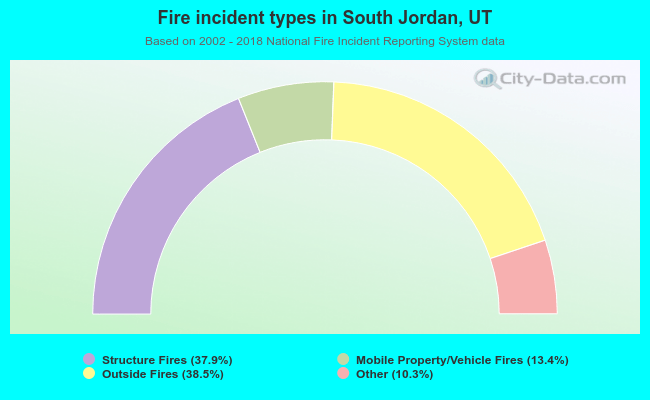 When looking into fire subcategories, the most incidents belonged to: Outside Fires (38.5%), and Structure Fires (37.9%).