Bluffdale: Fire Incidents, Utah (UT)
Where are fire incidents reported in Bluffdale, UT
Something went wrong! Please refresh the page.
|
| |||||||||||||||||||||||||||||||||||||||||||||||||||||||||||||||||||||||||||||||||||||||||||||||||||||||||||||
2002 - 2018 National Fire Incident Reporting System (NFIRS) incidents
- Incident types reported to NFIRS in Bluffdale, UT
- 31132.4%Fire
- 24325.3%Good Intent Call
- 14815.4%Hazardous Condition
- 13213.8%Rescue & EMS
- 757.8%False Alarm
- 454.7%Service Call
- 30.3%Severe Weather
- 20.2%Special Incident
- Fire incident types reported to NFIRS in Bluffdale, UT
- 18358.8%Outside Fires
- 8025.7%Structure Fires
- 3210.3%Mobile Property/Vehicle Fires
- 165.1%Other
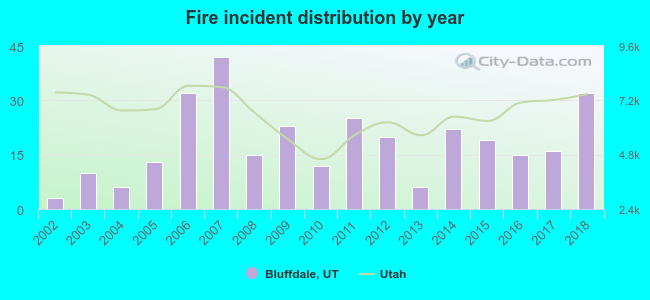 According to the data from the years 2002 - 2018 the average number of fires per year is 18. The highest number of reported fire incidents - 42 took place in 2007, and the least - 3 in 2002. The data has an increasing trend.
The average number of yearly fire incidents per 10k residents in Bluffdale, UT compared to nearest cities:
(Note: Based on data for the last 3 years, including only cities with population 5,000 and above)
| Bluffdale: | 21.2 |
| Riverton: | 10.3 |
| Draper: | 16.0 |
| Herriman: | 16.2 |
| South Jordan: | 9.0 |
| Lehi: | 16.5 |
| Sandy: | 2.3 |
| Highland: | 7.4 |
| Alpine: | 8.2 |
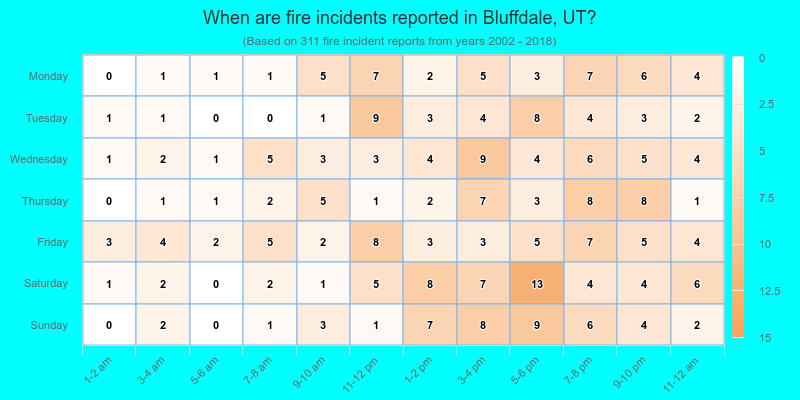
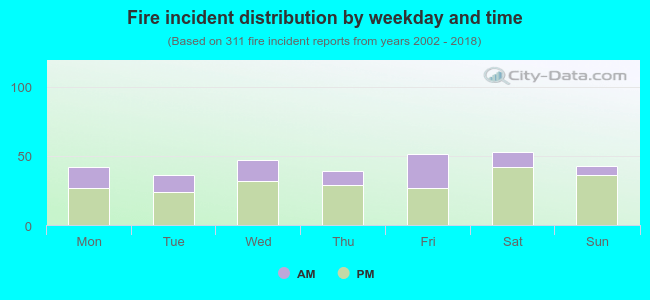 30.2% incidents where reported in the morning and 69.8% in the evening. The most fires (17.0%) took place on Saturday, and the least (11.6%) on Tuesday.
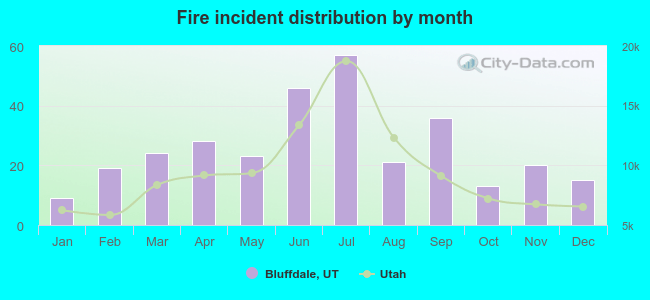 According to the 311 reports from years 2002 - 2018 most fires (18.3%) took place during July, and the least (2.9%) in January.
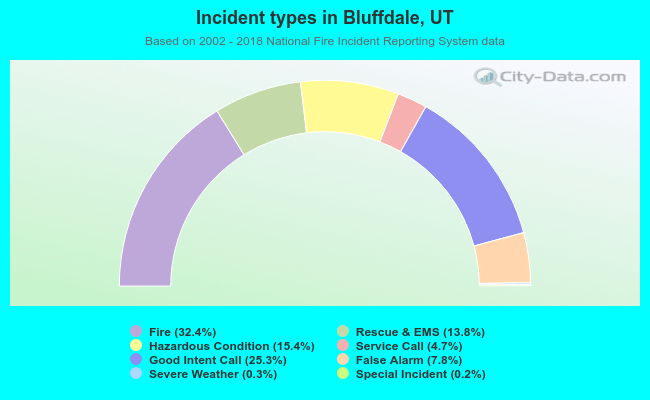 Out of all 959 cases reported during the years 2002 - 2018, the most belonged to the categories: Fire (32.4%), Service Call (25.3%), and Rescue & EMS (15.4%).
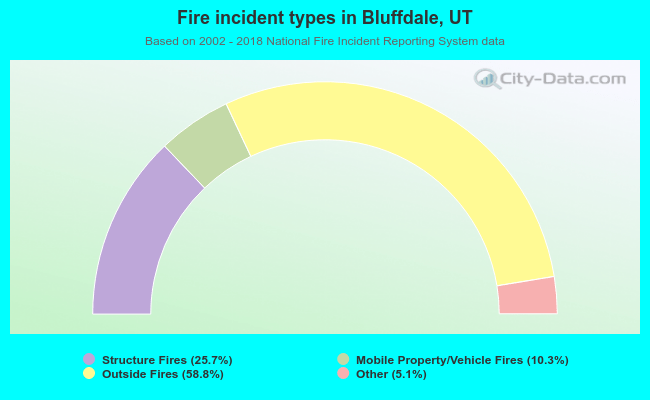 When looking into fire subcategories, the most reports belonged to: Outside Fires (58.8%), and Structure Fires (25.7%).