Soquel: Fire Incidents, California (CA)
Where are fire incidents reported in Soquel, CA
Something went wrong! Please refresh the page.
|
| |||||||||||||||||||||||||||||||||||||||||||||||||||||||||||||||||||||||||||||||||||||||||||||||||||||||||||||
2005 - 2018 National Fire Incident Reporting System (NFIRS) incidents
- Incident types reported to NFIRS in Soquel, CA
- 1,70546.1%Rescue & EMS
- 69018.7%Good Intent Call
- 39610.7%Service Call
- 38310.4%Hazardous Condition
- 3208.7%Fire
- 1935.2%False Alarm
- 50.1%Overpressure Rupture
- 40.1%Special Incident
- Fire incident types reported to NFIRS in Soquel, CA
- 14745.9%Outside Fires
- 10733.4%Structure Fires
- 4413.8%Mobile Property/Vehicle Fires
- 226.9%Other
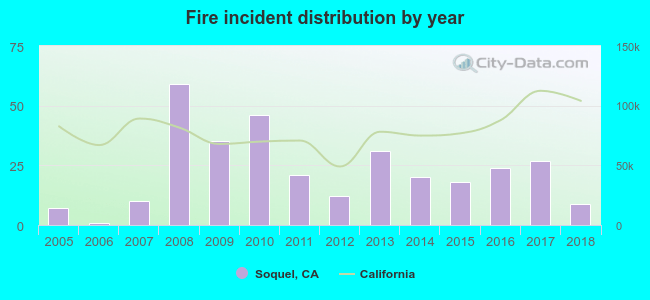 According to the data from the years 2005 - 2018 the average number of fires per year is 23. The highest number of reported fires - 59 took place in 2008, and the least - 1 in 2006. The data has a rising trend.
The average number of yearly fire incidents per 10k residents in Soquel, CA compared to nearest cities:
(Note: Based on data for the last 3 years, including only cities with population 5,000 and above)
| Soquel: | 20.7 |
| Capitola: | 25.3 |
| Live Oak: | 10.7 |
| Aptos: | 38.0 |
| Santa Cruz: | 23.9 |
| Scotts Valley: | 41.0 |
| Ben Lomond: | 30.5 |
| Watsonville: | 9.2 |
| Los Gatos: | 32.2 |
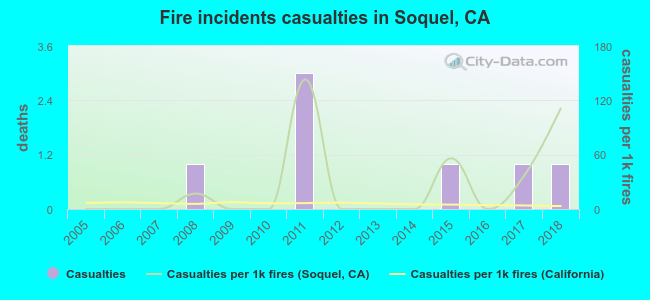 According to the reports from the years 2005 - 2018 the average number of fire-related casualties per year is 1. The highest number of reported casualties - 3 took place in 2011, and the lowest - 0 in 2005. The data has a rising trend.
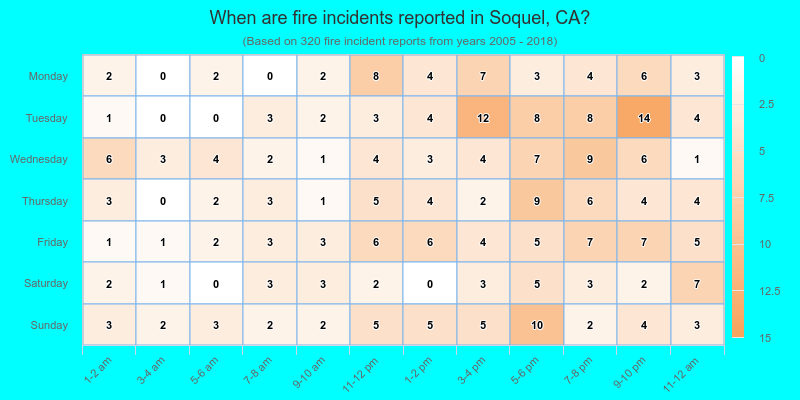
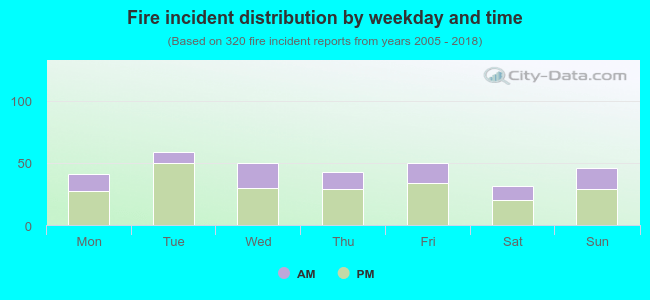 31.6% incidents where reported in the morning and 68.4% in the evening. The most fires (18.4%) took place on Tuesday, and the least (9.7%) on Saturday.
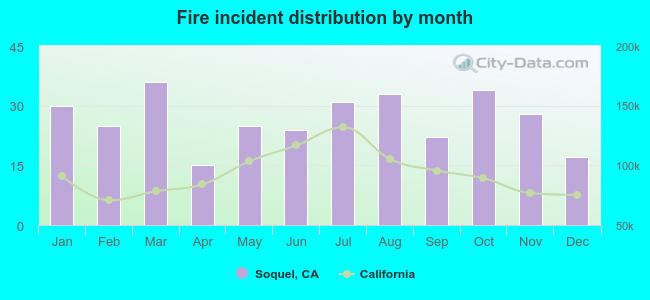 Based on the 320 fires from years 2005 - 2018 most fires (11.3%) took place during March, and the least (4.7%) in April.
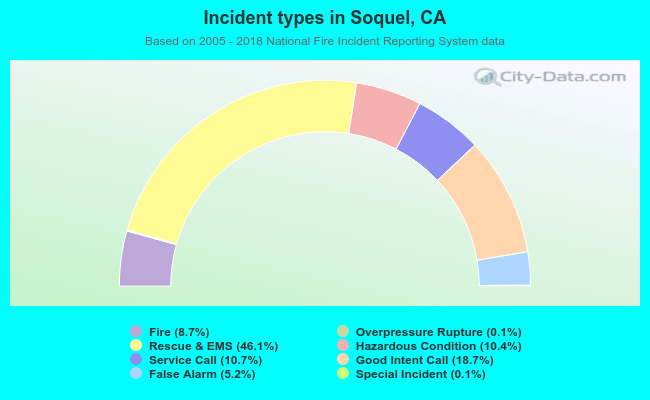 Out of all 3,696 cases reported during the years 2005 - 2018, the most belonged to the categories: Rescue & EMS (46.1%), Good Intent Call (18.7%), and Service Call (10.7%).
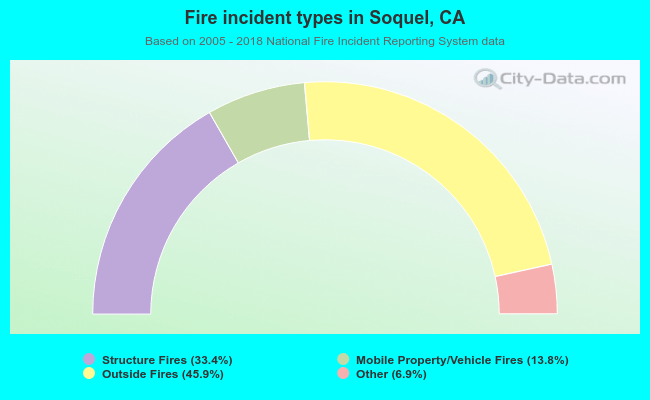 When looking into fire subcategories, the most incidents belonged to: Outside Fires (45.9%), and Structure Fires (33.4%).