Santa Cruz: Fire Incidents, California (CA)
Where are fire incidents reported in Santa Cruz, CA
Something went wrong! Please refresh the page.
| Fire incidents reported | |
|---|---|
| Sreet name | Count |
| SOQUEL AVE | 102 |
| E CLIFF DR | 74 |
| W CLIFF DR | 72 |
| 17TH AVE | 70 |
| OCEAN ST | 70 |
| PACIFIC AVE | 70 |
| BROMMER ST | 68 |
| MISSION ST | 66 |
| BEACH ST | 64 |
| RIVER ST | 60 |
| 7TH AVE | 52 |
| EMPIRE GRADE RD | 52 |
| PORTOLA DR | 52 |
| FRONT ST | 50 |
| WATER ST | 50 |
| SR 9 | 46 |
| MARTIN RD | 44 |
| CHANTICLEER AVE | 42 |
| BRANCIFORTE DR | 38 |
| CAPITOLA RD | 38 |
| CLIFF DR | 38 |
| SOQUEL DR | 38 |
| 30TH AVE | 32 |
| BAY ST | 30 |
| HIGHWAY 17 | 30 |
| SEABRIGHT AVE | 30 |
| 5TH AVE | 24 |
| RIVERSIDE AVE | 24 |
| CENTER ST | 22 |
| CORAL ST | 22 |
| Other | 487 |
2002 - 2018 National Fire Incident Reporting System (NFIRS) incidents
- Incident types reported to NFIRS in Santa Cruz, CA
- 12,86450.0%Rescue & EMS
- 5,06119.7%Good Intent Call
- 2,3089.0%Hazardous Condition
- 2,2568.8%Service Call
- 1,9577.6%Fire
- 1,2364.8%False Alarm
- 280.1%Special Incident
- Fire incident types reported to NFIRS in Santa Cruz, CA
- 91746.9%Outside Fires
- 68535.0%Structure Fires
- 25112.8%Mobile Property/Vehicle Fires
- 1045.3%Other
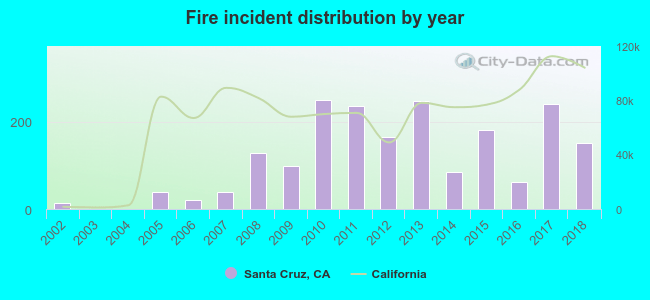 Based on the data from the years 2002 - 2018 the average number of fire incidents per year is 115. The highest number of reported fire incidents - 249 took place in 2010, and the least - 0 in 2003. The data has a growing trend.
The average number of yearly fire incidents per 10k residents in Santa Cruz, CA compared to nearest cities:
(Note: Based on data for the last 3 years, including only cities with population 5,000 and above)
| Santa Cruz: | 23.9 |
| Live Oak: | 10.7 |
| Capitola: | 25.3 |
| Soquel: | 20.7 |
| Scotts Valley: | 41.0 |
| Aptos: | 38.0 |
| Ben Lomond: | 30.5 |
| Watsonville: | 9.2 |
| Los Gatos: | 32.2 |
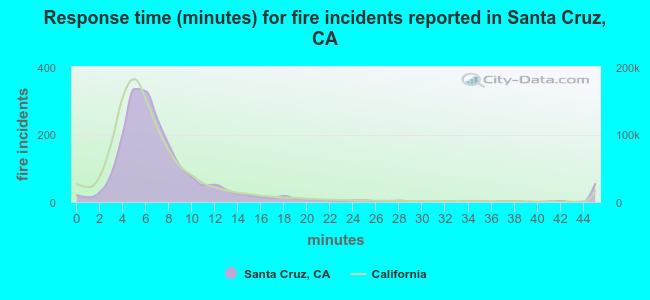 The median response time based on all reported fire incidents is 6 minutes. This is similar to the California median value.
The median response time in Santa Cruz, CA compared to nearest cities:
(Note: Based on data for all years, including only cities with at least 500 fire incidents)
| Santa Cruz: | 6 minutes |
| Live Oak: | 6 minutes |
| Scotts Valley: | 7 minutes |
| Aptos: | 7 minutes |
| Watsonville: | 11 minutes |
| Los Gatos: | 6 minutes |
| Campbell: | 5 minutes |
| Prunedale: | 8 minutes |
| Morgan Hill: | 6 minutes |
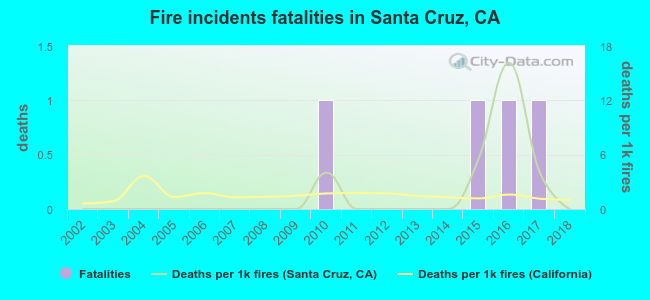 According to the reports from the years 2002 - 2018 the average number of fire-related yearly deaths is 0. The highest number of deaths - 1 took place in 2010, and the lowest - 0 in 2002. The data has a constant trend.
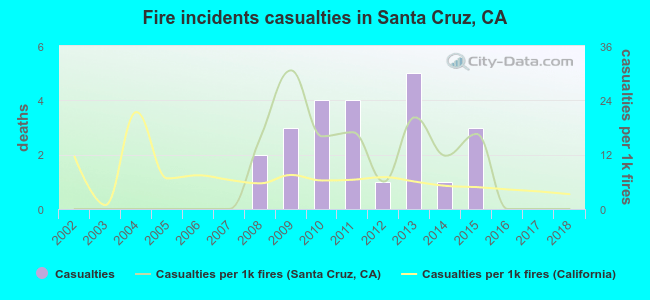 According to the reports from the years 2002 - 2018 the average number of fire-related casualties per year is 1. The highest number of injuries - 5 took place in 2013, and the lowest - 0 in 2002. The data has a constant trend.
The average number of injuries per 1,000 fires is 8. This indicator was the highest - 31 in 2009, and the lowest 0 in 2002. The trend for injuries per 1,000 incidents is increasing. Compared to the California value the number of injuries per 1,000 fires is much higher.
According to the reports from the years 2002 - 2018 the average number of fire-related casualties per year is 1. The highest number of injuries - 5 took place in 2013, and the lowest - 0 in 2002. The data has a constant trend.
The average number of injuries per 1,000 fires is 8. This indicator was the highest - 31 in 2009, and the lowest 0 in 2002. The trend for injuries per 1,000 incidents is increasing. Compared to the California value the number of injuries per 1,000 fires is much higher.Casualties per 1,000 incidents in Santa Cruz, CA compared to nearest cities:
(Note: Based on data for all years, including only cities with at least 500 fire incidents)
| Santa Cruz: | 11.8 |
| Live Oak: | 9.0 |
| Scotts Valley: | 7.0 |
| Aptos: | 12.8 |
| Watsonville: | 2.4 |
| Los Gatos: | 19.7 |
| Campbell: | 24.7 |
| Prunedale: | 3.8 |
| Morgan Hill: | 14.2 |
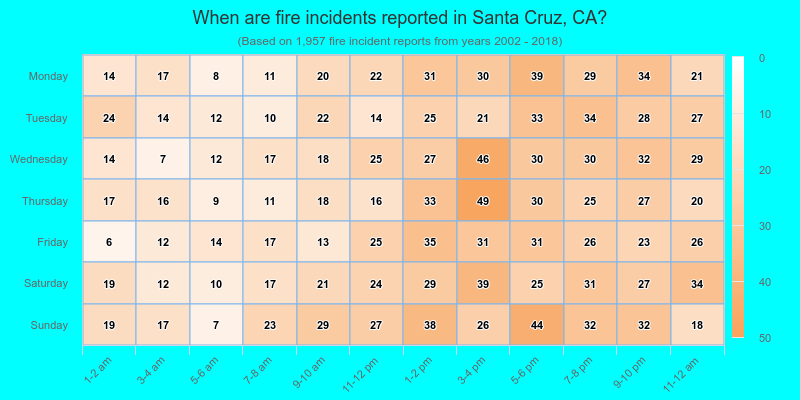
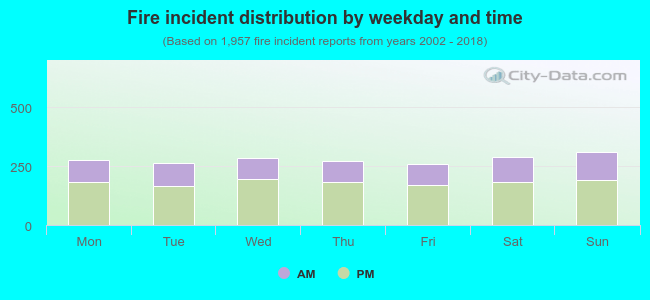 34.7% incidents where reported in the morning and 65.3% in the evening. The most fires (15.9%) took place on Sunday, and the least (13.2%) on Friday.
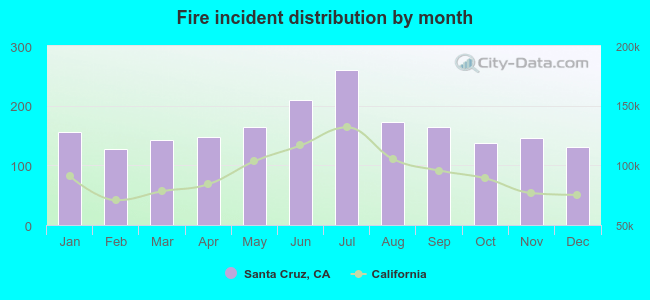 Based on the 1,957 incident reports from years 2002 - 2018 most fires (13.2%) took place during July, and the least (6.5%) in February.
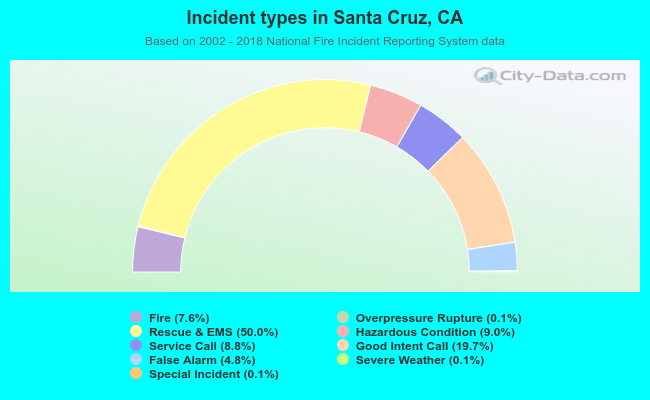 Out of all 25,744 cases reported during the years 2002 - 2018, the most belonged to the categories: Rescue & EMS (50.0%), Good Intent Call (19.7%), and Hazardous Condition (9.0%).
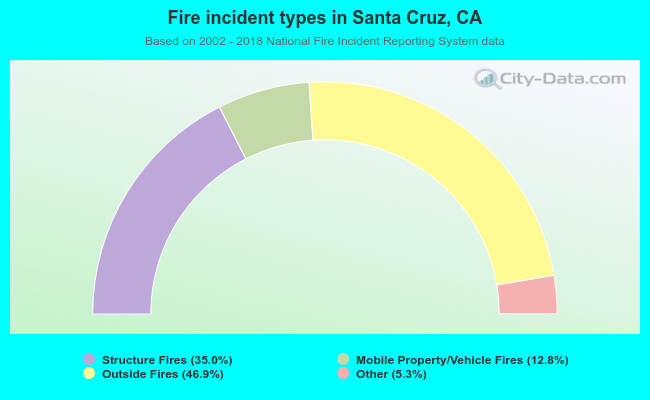 When looking into fire subcategories, the most incidents belonged to: Outside Fires (46.9%), and Structure Fires (35.0%).