Smithfield: Fire Incidents, Rhode Island (RI)
Where are fire incidents reported in Smithfield, RI
Something went wrong! Please refresh the page.
| Fire incidents reported | |
|---|---|
| Sreet name | Count |
| PUTNAM PIKE | 204 |
| DOUGLAS PIKE | 140 |
| FARNUM PIKE | 64 |
| GEORGE WASHINGTON HWY | 38 |
| STILLWATER RD | 32 |
| PLEASANT VIEW AVE | 28 |
| WATERMAN AVE | 22 |
| RT 295 | 20 |
| LOG RD | 16 |
| SANDERSON RD | 16 |
| SMITH AVE | 16 |
| AUSTIN AVE | 14 |
| HIGGINS ST | 14 |
| RT 295 NORTH | 14 |
| MANN SCHOOL RD | 12 |
| RANDALL ST | 12 |
| SPRAGUE ST | 12 |
| CEDAR SWAMP RD | 10 |
| INDIAN RUN TRL | 10 |
| RIDGE RD | 10 |
| BREEZY KNOLL RD | 8 |
| ESMOND ST | 8 |
| JOHN MOWRY RD | 8 |
| LAKESIDE DR | 8 |
| LIMEROCK RD | 8 |
| MOUNTAINDALE RD | 8 |
| OLD COUNTY RD | 8 |
| PINEWOOD DR | 8 |
| RT 295S EXIT 8A | 8 |
| SEBILLE RD | 8 |
2009 - 2018 National Fire Incident Reporting System (NFIRS) incidents
- Incident types reported to NFIRS in Smithfield, RI
- 11,68271.9%Rescue & EMS
- 1,5769.7%False Alarm
- 9195.7%Service Call
- 8495.2%Hazardous Condition
- 6544.0%Fire
- 5533.4%Good Intent Call
- Fire incident types reported to NFIRS in Smithfield, RI
- 28143.0%Structure Fires
- 21633.0%Outside Fires
- 11918.2%Mobile Property/Vehicle Fires
- 385.8%Other
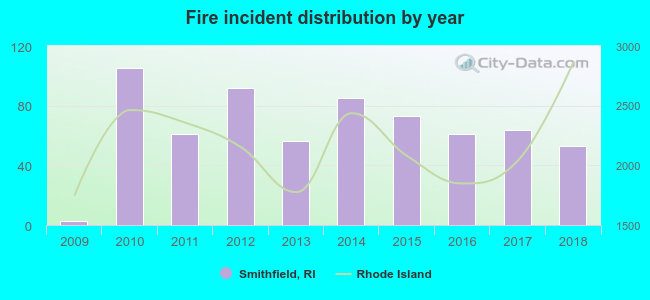 According to the data from the years 2009 - 2018 the average number of fire incidents per year is 65. The highest number of fire incidents - 105 took place in 2010, and the least - 3 in 2009. The data has a growing trend.
The average number of yearly fire incidents per 10k residents in Smithfield, RI compared to nearest cities:
(Note: Based on data for the last 3 years, including only cities with population 5,000 and above)
| Smithfield: | 27.7 |
| Johnston: | 26.6 |
| Lincoln: | 31.0 |
| North Smithfield: | 12.0 |
| Providence: | 4.8 |
| Central Falls: | 96.2 |
| Cumberland: | 39.7 |
| Glocester: | 1.0 |
| Scituate: | 3.9 |
 The median response time based on all reported fire incidents is 6 minutes. This is similar to the Rhode Island median value.
The median response time in Smithfield, RI compared to nearest cities:
(Note: Based on data for all years, including only cities with at least 500 fire incidents)
| Smithfield: | 6 minutes |
| North Providence: | 4 minutes |
| Lincoln: | 4 minutes |
| Providence: | 5 minutes |
| Central Falls: | 2 minutes |
| Cumberland: | 6 minutes |
| Woonsocket: | 5 minutes |
| Cranston: | 4 minutes |
| Blackstone: | 5 minutes |
 30.3% incidents where reported in the morning and 69.7% in the evening. The most fires (16.5%) took place on Monday, and the least (12.5%) on Thursday.
 Based on the 654 fire incident reports from years 2009 - 2018 most fires (12.7%) took place during April, and the least (4.6%) in February.
 Out of all 16,254 cases reported during the years 2009 - 2018, the most belonged to the categories: Rescue & EMS (71.9%), False Alarm (9.7%), and Service Call (5.7%).
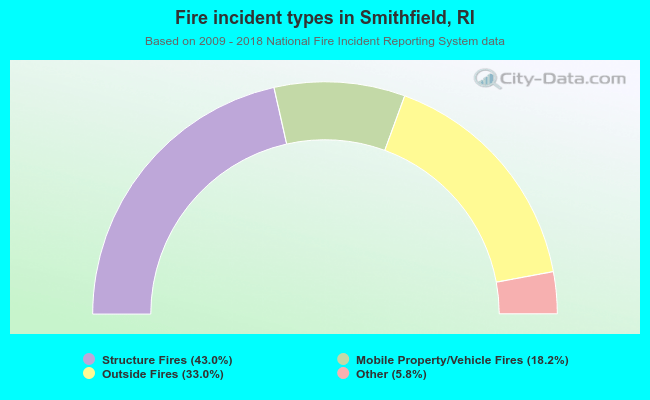 When looking into fire subcategories, the most incidents belonged to: Structure Fires (43.0%), and Outside Fires (33.0%).