Sherman: Fire Incidents, Texas (TX)
Where are fire incidents reported in Sherman, TX
Something went wrong! Please refresh the page.
| Fire incidents reported | |
|---|---|
| Sreet name | Count |
| HIGHWAY 75 | 296 |
| HIGHWAY 82 | 206 |
| TRAVIS ST | 196 |
| 75 | 142 |
| LAMAR ST | 128 |
| TAYLOR ST | 110 |
| HOUSTON ST | 104 |
| TEXOMA | 88 |
| 1417 | 84 |
| 75 US | 80 |
| TEXOMA PARKWAY | 68 |
| 82 | 62 |
| WASHINGTON ST | 62 |
| FIRST ST | 60 |
| HERITAGE | 60 |
| FM 1417 | 58 |
| LASALLE DR | 56 |
| WALNUT ST | 56 |
| TEXOMA PK | 52 |
| GRAND AVE | 48 |
| HIGHWAY 56 | 46 |
| CROCKETT ST | 44 |
| DRIPPING SPRINGS RD | 44 |
| WOODS ST | 42 |
| 82 US | 40 |
| HWY 82 | 40 |
| PLAINVIEW RD | 40 |
| TEXOMA PKWY | 38 |
| 1417 FM | 36 |
| JONES ST | 36 |
| Other | 1,145 |
2002 - 2018 National Fire Incident Reporting System (NFIRS) incidents
- Incident types reported to NFIRS in Sherman, TX
- 26,54471.2%Rescue & EMS
- 3,5679.6%Fire
- 3,2008.6%Good Intent Call
- 2,0865.6%Hazardous Condition
- 1,3213.5%False Alarm
- 4871.3%Service Call
- 450.1%Special Incident
- Fire incident types reported to NFIRS in Sherman, TX
- 2,03557.1%Outside Fires
- 86624.3%Structure Fires
- 53014.9%Mobile Property/Vehicle Fires
- 1363.8%Other
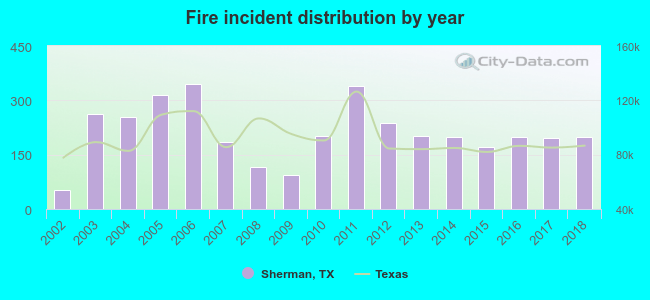 Based on the data from the years 2002 - 2018 the average number of fires per year is 210. The highest number of fire incidents - 345 took place in 2006, and the least - 53 in 2002. The data has a growing trend.
The average number of yearly fire incidents per 10k residents in Sherman, TX compared to nearest cities:
(Note: Based on data for the last 3 years, including only cities with population 5,000 and above)
| Sherman: | 49.5 |
| Denison: | 83.7 |
| Anna: | 104.4 |
| Celina: | 84.7 |
| Melissa: | 104.9 |
| Bonham: | 63.3 |
| Prosper: | 41.9 |
| Gainesville: | 126.7 |
| McKinney: | 16.5 |
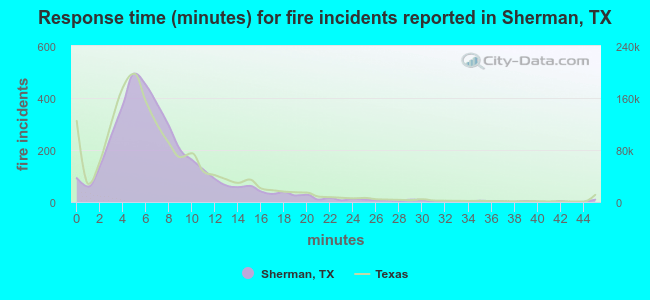 The median response time based on all reported fire incidents is 6 minutes. This is comparable to the Texas median value.
The median response time in Sherman, TX compared to nearest cities:
(Note: Based on data for all years, including only cities with at least 500 fire incidents)
| Sherman: | 6 minutes |
| Denison: | 7 minutes |
| Pottsboro: | 8 minutes |
| Bells: | 10 minutes |
| Van Alstyne: | 7 minutes |
| Whitewright: | 11 minutes |
| Colbert: | 8 minutes |
| Whitesboro: | 11 minutes |
| Anna: | 9 minutes |
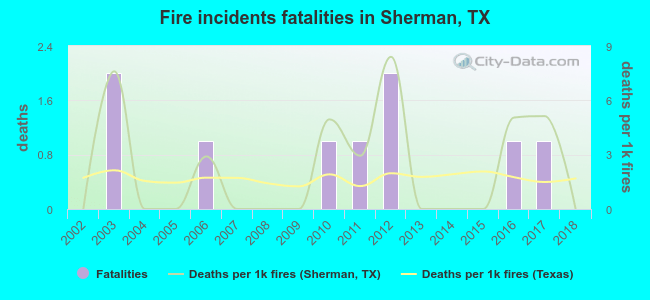 Based on the reports from the years 2002 - 2018 the average number of fire-related fatalities per year is 1. The highest number of deaths - 2 took place in 2003, and the lowest - 0 in 2002. The data has a constant trend.
The average number of deaths per 1,000 fires is 2. This indicator was the highest - 8 in 2012, and the lowest 0 in 2002. The trend for fatalities per 1,000 incidents is growing. Compared to the state value the number of deaths per 1,000 incidents is higher.
Based on the reports from the years 2002 - 2018 the average number of fire-related fatalities per year is 1. The highest number of deaths - 2 took place in 2003, and the lowest - 0 in 2002. The data has a constant trend.
The average number of deaths per 1,000 fires is 2. This indicator was the highest - 8 in 2012, and the lowest 0 in 2002. The trend for fatalities per 1,000 incidents is growing. Compared to the state value the number of deaths per 1,000 incidents is higher.Deaths per 1,000 incidents in Sherman, TX compared to nearest cities:
(Note: Based on data for all years, including only cities with at least 2,500 fire incidents)
| Sherman: | 2.5 |
| Denison: | 2.7 |
| Durant: | 1.1 |
| Gainesville: | 1.4 |
| McKinney: | 2.8 |
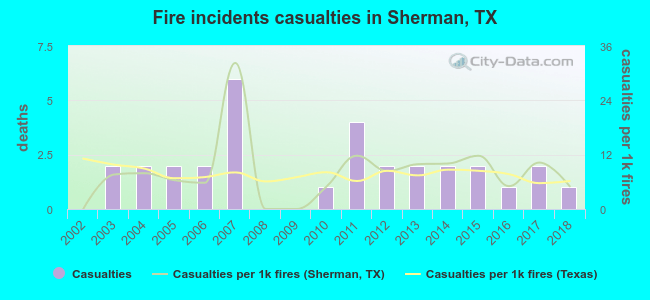 According to the data from the years 2002 - 2018 the average number of fire-related yearly casualties is 2. The highest number of injuries - 6 took place in 2007, and the lowest - 0 in 2002. The data has a growing trend.
The average number of casualties per 1,000 fire incidents is 8. This indicator was the highest - 32 in 2007, and the lowest 0 in 2002. The trend for injuries per 1,000 incidents is growing. Compared to the state value the number of injuries per 1,000 fire incidents is similar.
According to the data from the years 2002 - 2018 the average number of fire-related yearly casualties is 2. The highest number of injuries - 6 took place in 2007, and the lowest - 0 in 2002. The data has a growing trend.
The average number of casualties per 1,000 fire incidents is 8. This indicator was the highest - 32 in 2007, and the lowest 0 in 2002. The trend for injuries per 1,000 incidents is growing. Compared to the state value the number of injuries per 1,000 fire incidents is similar.Casualties per 1,000 incidents in Sherman, TX compared to nearest cities:
(Note: Based on data for all years, including only cities with at least 500 fire incidents)
| Sherman: | 8.7 |
| Denison: | 13.5 |
| Pottsboro: | 1.2 |
| Bells: | 1.5 |
| Van Alstyne: | 1.4 |
| Whitewright: | 0.0 |
| Colbert: | 1.9 |
| Whitesboro: | 0.9 |
| Anna: | 9.9 |
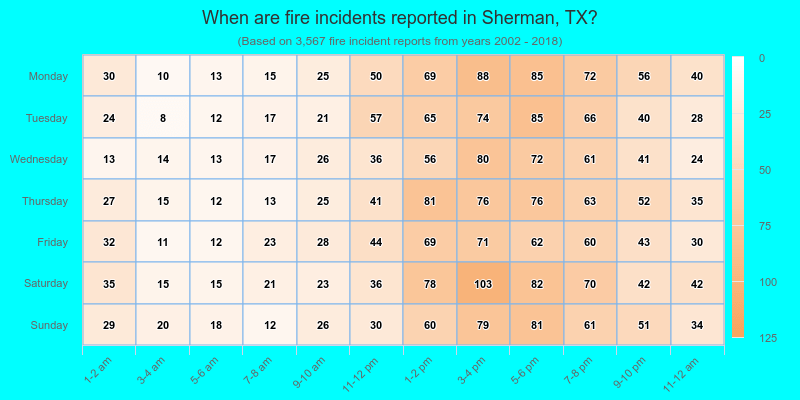
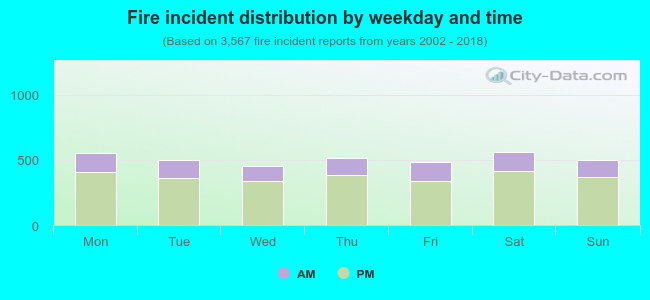 27.0% incidents where reported in the morning and 73.0% in the evening. The most fires (15.8%) took place on Saturday, and the least (12.7%) on Wednesday.
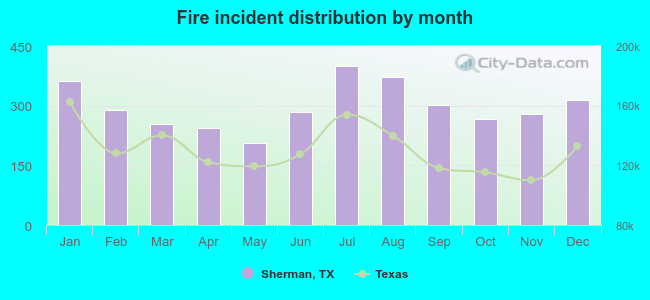 According to the 3,567 fire incident reports from years 2002 - 2018 most fires (11.2%) took place during July, and the least (5.8%) in May.
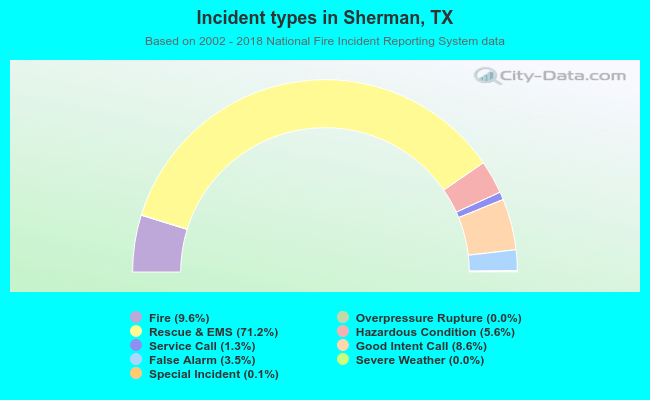 Out of all 37,283 cases reported during the years 2002 - 2018, the most belonged to the categories: Rescue & EMS (71.2%), Fire (9.6%), and Good Intent Call (8.6%).
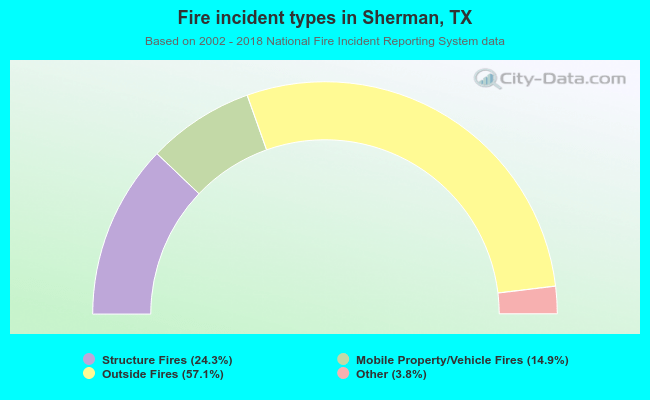 When looking into fire subcategories, the most incidents belonged to: Outside Fires (57.1%), and Structure Fires (24.3%).