Durant: Fire Incidents, Oklahoma (OK)
Where are fire incidents reported in Durant, OK
Something went wrong! Please refresh the page.
| Fire incidents reported | |
|---|---|
| Sreet name | Count |
| MAIN ST | 214 |
| 1ST ST | 100 |
| 1ST AVE | 82 |
| 2ND | 68 |
| ARKANSAS ST | 62 |
| TEXAS ST | 60 |
| WALDRON DR | 58 |
| UNIVERSITY | 54 |
| CEMETERY RD | 48 |
| GATES AVE | 48 |
| MISSISSIPPI | 48 |
| TEXAS | 48 |
| 2ND AVE | 46 |
| 3RD AVE | 46 |
| LOUISIANA ST | 46 |
| MISSISSIPPI ST | 46 |
| SAWMILL RD | 46 |
| UNIVERSITY BLVD | 46 |
| 2ND ST | 42 |
| 9TH AVE | 42 |
| WESTSIDE DR | 42 |
| 9TH ST | 40 |
| MAIN | 40 |
| 3RD ST | 38 |
| 4TH AVE | 36 |
| 3RD | 34 |
| 4TH ST | 34 |
| WASHINGTON | 34 |
| 4TH | 32 |
| 5TH AVE | 32 |
| Other | 1,135 |
2002 - 2018 National Fire Incident Reporting System (NFIRS) incidents
- Incident types reported to NFIRS in Durant, OK
- 5,42252.2%Rescue & EMS
- 2,74726.4%Fire
- 7247.0%Hazardous Condition
- 6606.4%Good Intent Call
- 4514.3%False Alarm
- 3413.3%Service Call
- 300.3%Special Incident
- Fire incident types reported to NFIRS in Durant, OK
- 1,64259.8%Outside Fires
- 61622.4%Structure Fires
- 33312.1%Mobile Property/Vehicle Fires
- 1565.7%Other
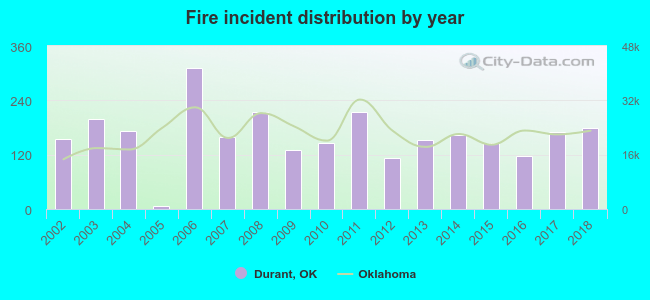 According to the data from the years 2002 - 2018 the average number of fire incidents per year is 162. The highest number of reported fire incidents - 312 took place in 2006, and the least - 6 in 2005. The data has a rising trend.
The average number of yearly fire incidents per 10k residents in Durant, OK compared to nearest cities:
(Note: Based on data for the last 3 years, including only cities with population 5,000 and above)
| Durant: | 91.3 |
 The median response time based on all reported fire incidents is 4 minutes. This is lower compared to the Oklahoma median value.
The median response time in Durant, OK compared to nearest cities:
(Note: Based on data for all years, including only cities with at least 500 fire incidents)
| Durant: | 4 minutes |
| Colbert: | 8 minutes |
| Kingston: | 8 minutes |
| Tishomingo: | 5 minutes |
| Atoka: | 9 minutes |
 Based on the data from the years 2002 - 2018 the average number of fire-related casualties per year is 0. The highest number of reported casualties - 2 took place in 2008, and the lowest - 0 in 2002. The data has a constant trend.
The average number of casualties per 1,000 fires is 2. This indicator was the highest - 9 in 2008, and the lowest 0 in 2002. The trend for casualties per 1,000 fire incidents is rising. Compared to the Oklahoma value the number of injuries per 1,000 fires is lower.
Based on the data from the years 2002 - 2018 the average number of fire-related casualties per year is 0. The highest number of reported casualties - 2 took place in 2008, and the lowest - 0 in 2002. The data has a constant trend.
The average number of casualties per 1,000 fires is 2. This indicator was the highest - 9 in 2008, and the lowest 0 in 2002. The trend for casualties per 1,000 fire incidents is rising. Compared to the Oklahoma value the number of injuries per 1,000 fires is lower.Casualties per 1,000 incidents in Durant, OK compared to nearest cities:
(Note: Based on data for all years, including only cities with at least 500 fire incidents)
| Durant: | 2.2 |
| Colbert: | 1.9 |
| Kingston: | 2.9 |
| Tishomingo: | 0.0 |
| Atoka: | 0.0 |
 27.6% incidents where reported in the morning and 72.4% in the evening. The most fires (15.3%) took place on Sunday, and the least (13.4%) on Wednesday.
 Based on the 2,747 reports from years 2002 - 2018 most fires (11.5%) took place during July, and the least (5.4%) in May.
 Out of all 10,392 cases reported during the years 2002 - 2018, the most belonged to the categories: Rescue & EMS (52.2%), Fire (26.4%), and Hazardous Condition (7.0%).
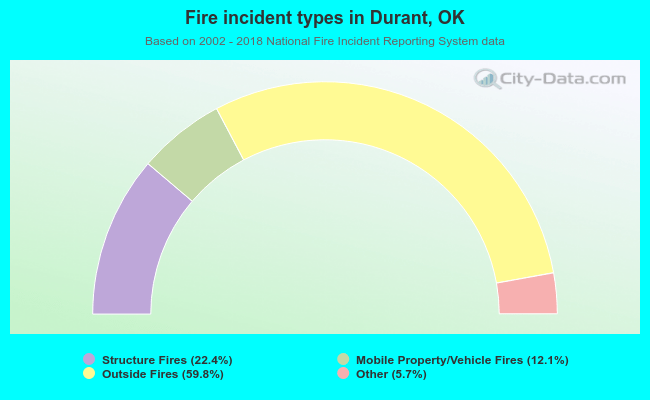 When looking into fire subcategories, the most incidents belonged to: Outside Fires (59.8%), and Structure Fires (22.4%).