San Martin: Fire Incidents, California (CA)
Where are fire incidents reported in San Martin, CA
Something went wrong! Please refresh the page.
|
| |||||||||||||||||||||||||||||||||||||||||||||||||||||||||||||||||||||||||||||||||||||||||||||||||||||||||||||
2005 - 2018 National Fire Incident Reporting System (NFIRS) incidents
- Incident types reported to NFIRS in San Martin, CA
- 15331.1%Rescue & EMS
- 14629.7%Fire
- 12425.2%Good Intent Call
- 316.3%Hazardous Condition
- 214.3%Service Call
- 153.0%False Alarm
- 10.2%Overpressure Rupture
- 10.2%Special Incident
- Fire incident types reported to NFIRS in San Martin, CA
- 6443.8%Outside Fires
- 5739.0%Structure Fires
- 1812.3%Mobile Property/Vehicle Fires
- 74.8%Other
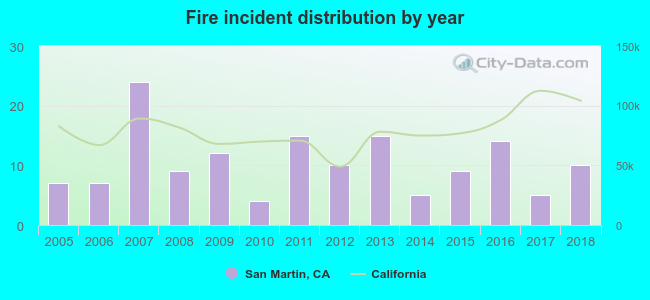 According to the data from the years 2005 - 2018 the average number of fire incidents per year is 10. The highest number of fires - 24 took place in 2007, and the least - 4 in 2010. The data has a rising trend.
The average number of yearly fire incidents per 10k residents in San Martin, CA compared to nearest cities:
(Note: Based on data for the last 3 years, including only cities with population 5,000 and above)
| San Martin: | 13.8 |
| Morgan Hill: | 4.1 |
| Gilroy: | 55.0 |
| Watsonville: | 9.2 |
| Aptos: | 38.0 |
| Hollister: | 26.9 |
| Prunedale: | 20.7 |
| Soquel: | 20.7 |
| Capitola: | 25.3 |
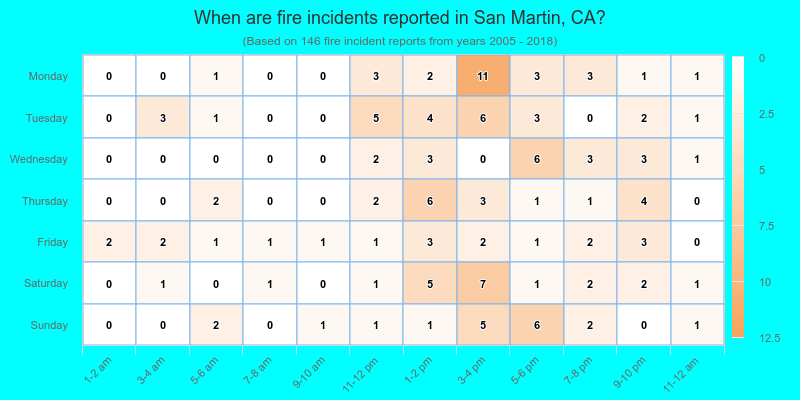
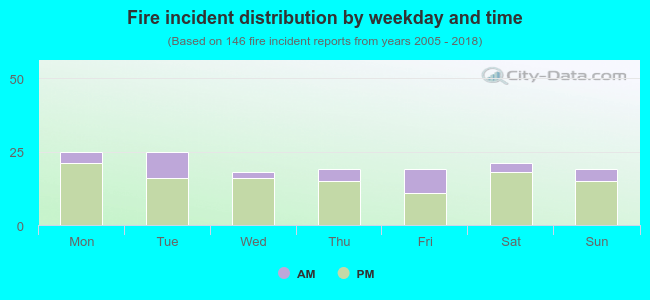 23.3% incidents where reported in the morning and 76.7% in the evening. The most fires (17.1%) took place on Monday, and the least (12.3%) on Wednesday.
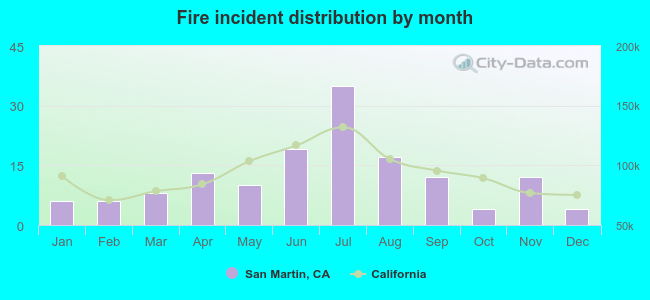 According to the 146 fire incident reports from years 2005 - 2018 most fires (24.0%) took place during July, and the least (2.7%) in October.
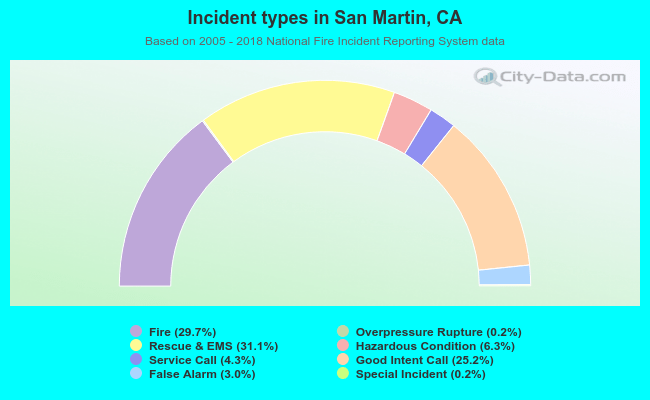 Out of all 492 cases reported during the years 2005 - 2018, the most belonged to the categories: Rescue & EMS (31.1%), Fire (29.7%), and Good Intent Call (25.2%).
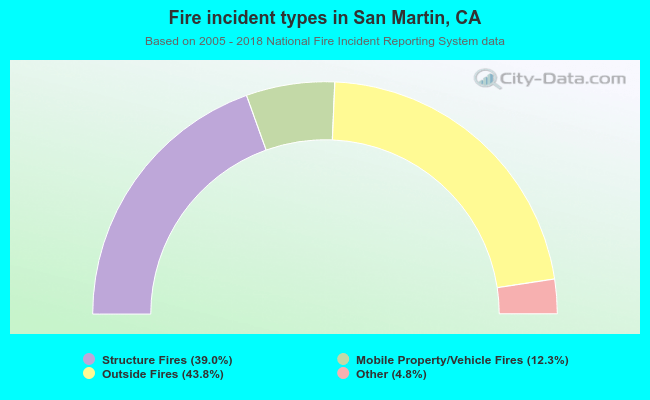 When looking into fire subcategories, the most incidents belonged to: Outside Fires (43.8%), and Structure Fires (39.0%).