Rupert: Fire Incidents, Idaho (ID)
Where are fire incidents reported in Rupert, ID
Something went wrong! Please refresh the page.
|
| |||||||||||||||||||||||||||||||||||||||||||||||||||||||||||||||||||||||||||||||||||||||||||||||||||||||||||||
| Other | 720 | |||||||||||||||||||||||||||||||||||||||||||||||||||||||||||||||||||||||||||||||||||||||||||||||||||||||||||||
2002 - 2018 National Fire Incident Reporting System (NFIRS) incidents
- Incident types reported to NFIRS in Rupert, ID
- 1,50842.4%Rescue & EMS
- 1,27435.8%Fire
- 3229.1%Hazardous Condition
- 1724.8%Good Intent Call
- 1614.5%Service Call
- 1093.1%False Alarm
- 70.2%Overpressure Rupture
- Fire incident types reported to NFIRS in Rupert, ID
- 80963.5%Outside Fires
- 30123.6%Structure Fires
- 13010.2%Mobile Property/Vehicle Fires
- 342.7%Other
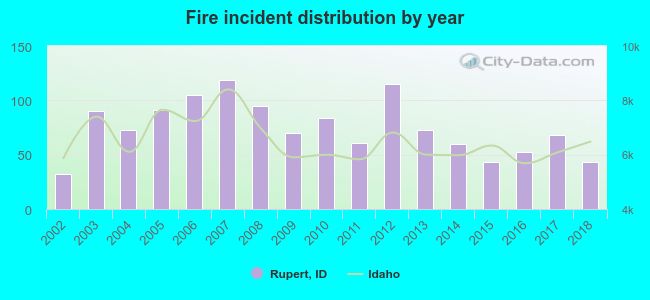 Based on the data from the years 2002 - 2018 the average number of fires per year is 75. The highest number of reported fires - 119 took place in 2007, and the least - 32 in 2002. The data has a growing trend.
The average number of yearly fire incidents per 10k residents in Rupert, ID compared to nearest cities:
(Note: Based on data for the last 3 years, including only cities with population 5,000 and above)
| Rupert: | 95.8 |
| Burley: | 83.7 |
| Twin Falls: | 26.6 |
| Jerome: | 129.3 |
| Chubbuck: | 18.5 |
| Pocatello: | 25.5 |
| Hailey: | 76.8 |
| Moreland: | 1.0 |
| Blackfoot: | 129.8 |
 The median response time based on all reported fire incidents is 6 minutes. This is similar to the state median value.
The median response time in Rupert, ID compared to nearest cities:
(Note: Based on data for all years, including only cities with at least 500 fire incidents)
| Rupert: | 6 minutes |
| Paul: | 6 minutes |
| Heyburn: | 6 minutes |
| Burley: | 6 minutes |
| Kimberly: | 9 minutes |
| Twin Falls: | 5 minutes |
| Jerome: | 7 minutes |
| Filer: | 9 minutes |
| Wendell: | 8 minutes |
 According to the reports from the years 2002 - 2018 the average number of fire-related fatalities per year is 0. The highest number of deaths - 1 took place in 2010, and the lowest - 0 in 2002. The data has a constant trend.
 26.5% incidents where reported in the morning and 73.5% in the evening. The most fires (16.2%) took place on Wednesday, and the least (10.7%) on Sunday.
 According to the 1,274 fire incident reports from years 2002 - 2018 most fires (15.3%) took place during August, and the least (3.5%) in February.
 Out of all 3,556 cases reported during the years 2002 - 2018, the most belonged to the categories: Rescue & EMS (42.4%), Fire (35.8%), and Hazardous Condition (9.1%).
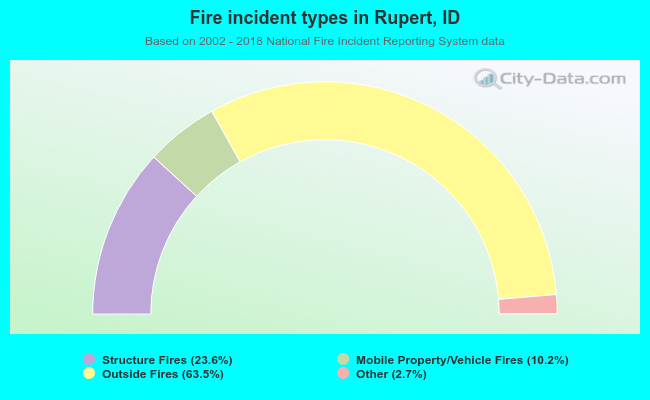 When looking into fire subcategories, the most reports belonged to: Outside Fires (63.5%), and Structure Fires (23.6%).