Wendell: Fire Incidents, Idaho (ID)
Where are fire incidents reported in Wendell, ID
Something went wrong! Please refresh the page.
|
| |||||||||||||||||||||||||||||||||||||||||||||||||||||||||||||||||||||||||||||||||||||||||||||||||||||||||||||
2002 - 2018 National Fire Incident Reporting System (NFIRS) incidents
- Incident types reported to NFIRS in Wendell, ID
- 1,20448.9%Fire
- 57623.4%Hazardous Condition
- 32913.4%Rescue & EMS
- 2188.9%Good Intent Call
- 652.6%Service Call
- 562.3%False Alarm
- 70.3%Special Incident
- 40.2%Severe Weather
- Fire incident types reported to NFIRS in Wendell, ID
- 77564.4%Outside Fires
- 22518.7%Mobile Property/Vehicle Fires
- 17514.5%Structure Fires
- 292.4%Other
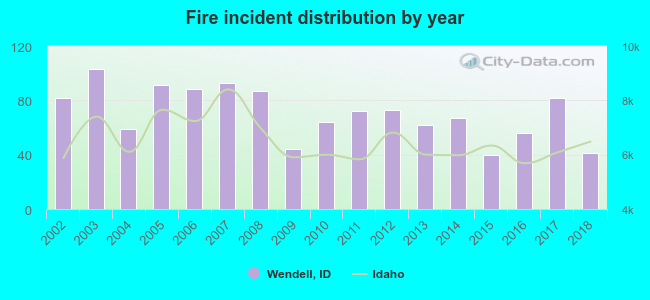 According to the data from the years 2002 - 2018 the average number of fires per year is 71. The highest number of reported fires - 103 took place in 2003, and the least - 40 in 2015. The data has a decreasing trend.
 The median response time based on all reported fire incidents is 8 minutes. This is comparable to the state median value.
The median response time in Wendell, ID compared to nearest cities:
(Note: Based on data for all years, including only cities with at least 500 fire incidents)
| Wendell: | 8 minutes |
| Jerome: | 7 minutes |
| Hagerman: | 11 minutes |
| Gooding: | 10 minutes |
| Buhl: | 8 minutes |
| Filer: | 9 minutes |
| Twin Falls: | 5 minutes |
| Kimberly: | 9 minutes |
| Paul: | 6 minutes |
 27.8% incidents where reported in the morning and 72.2% in the evening. The most fires (16.2%) took place on Thursday, and the least (11.9%) on Sunday.
 Based on the 1,204 fires from years 2002 - 2018 most fires (15.6%) took place during July, and the least (3.9%) in January.
 Out of all 2,461 cases reported during the years 2002 - 2018, the most belonged to the categories: Fire (48.9%), Hazardous Condition (23.4%), and Rescue & EMS (13.4%).
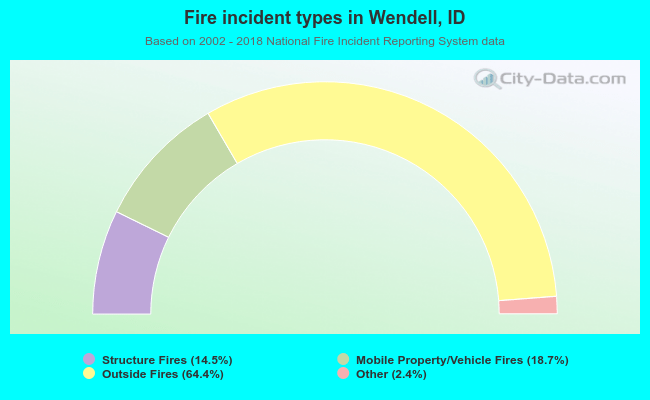 When looking into fire subcategories, the most reports belonged to: Outside Fires (64.4%), and Mobile Property/Vehicle Fires (18.7%).