Richburg: Fire Incidents, South Carolina (SC)
Where are fire incidents reported in Richburg, SC
Something went wrong! Please refresh the page.
|
| |||||||||||||||||||||||||||||||||||||||||||||||||||||||||||||||||||||||||||||||||||||||||||||||||||||||||||||
2002 - 2018 National Fire Incident Reporting System (NFIRS) incidents
- Incident types reported to NFIRS in Richburg, SC
- 1,48351.0%Rescue & EMS
- 66022.7%Fire
- 2498.6%Good Intent Call
- 2047.0%Service Call
- 1575.4%Hazardous Condition
- 1545.3%False Alarm
- Fire incident types reported to NFIRS in Richburg, SC
- 29945.3%Outside Fires
- 18327.7%Structure Fires
- 16525.0%Mobile Property/Vehicle Fires
- 132.0%Other
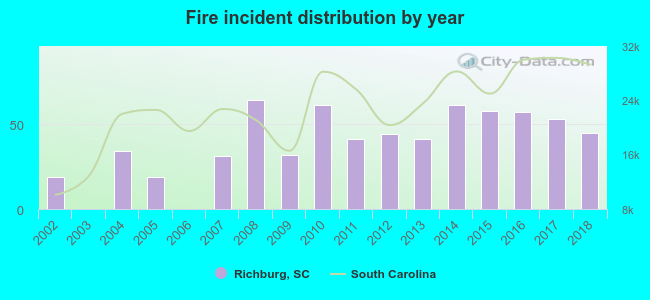 Based on the data from the years 2002 - 2018 the average number of fire incidents per year is 39. The highest number of fire incidents - 64 took place in 2008, and the least - 0 in 2003. The data has a rising trend.
 The median response time based on all reported fire incidents is 7 minutes. This is similar to the South Carolina median value.
The median response time in Richburg, SC compared to nearest cities:
(Note: Based on data for all years, including only cities with at least 500 fire incidents)
| Richburg: | 7 minutes |
| Chester: | 5 minutes |
| Great Falls: | 6 minutes |
| Lancaster: | 9 minutes |
| Rock Hill: | 6 minutes |
| Fort Mill: | 8 minutes |
| Waxhaw: | 8 minutes |
| Heath Springs: | 11 minutes |
| York: | 8 minutes |
 25.0% incidents where reported in the morning and 75.0% in the evening. The most fires (17.4%) took place on Friday, and the least (11.4%) on Monday.
 Based on the 660 incident reports from years 2002 - 2018 most fires (11.7%) took place during March, and the least (5.5%) in September.
 Out of all 2,910 cases reported during the years 2002 - 2018, the most belonged to the categories: Rescue & EMS (51.0%), Fire (22.7%), and Good Intent Call (8.6%).
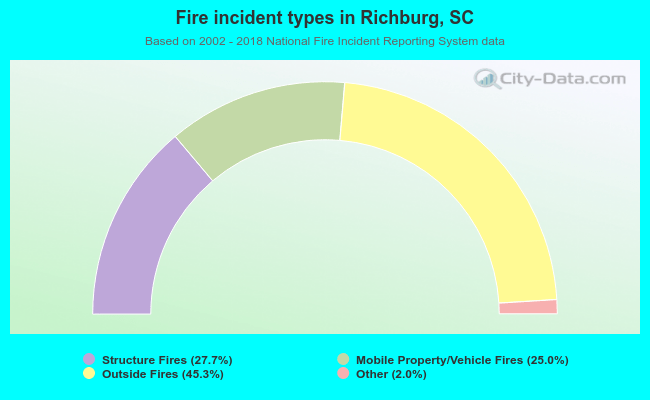 When looking into fire subcategories, the most incidents belonged to: Outside Fires (45.3%), and Structure Fires (27.7%).