Chester: Fire Incidents, South Carolina (SC)
Where are fire incidents reported in Chester, SC
Something went wrong! Please refresh the page.
|
| |||||||||||||||||||||||||||||||||||||||||||||||||||||||||||||||||||||||||||||||||||||||||||||||||||||||||||||
| Other | 141 | |||||||||||||||||||||||||||||||||||||||||||||||||||||||||||||||||||||||||||||||||||||||||||||||||||||||||||||
2004 - 2018 National Fire Incident Reporting System (NFIRS) incidents
- Incident types reported to NFIRS in Chester, SC
- 2,03036.4%Rescue & EMS
- 1,33924.0%Fire
- 85115.3%Good Intent Call
- 78514.1%Hazardous Condition
- 3255.8%False Alarm
- 2093.8%Service Call
- 280.5%Overpressure Rupture
- Fire incident types reported to NFIRS in Chester, SC
- 57743.1%Outside Fires
- 53540.0%Structure Fires
- 18313.7%Mobile Property/Vehicle Fires
- 443.3%Other
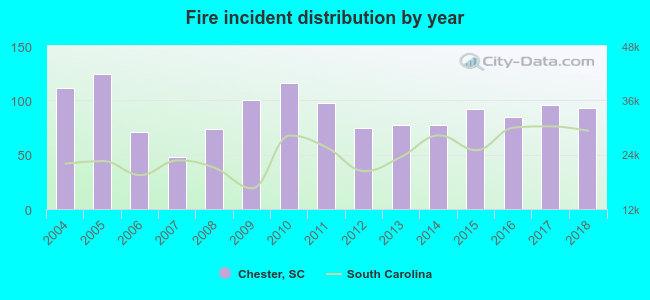 Based on the data from the years 2004 - 2018 the average number of fires per year is 89. The highest number of reported fire incidents - 124 took place in 2005, and the least - 48 in 2007. The data has a declining trend.
The average number of yearly fire incidents per 10k residents in Chester, SC compared to nearest cities:
(Note: Based on data for the last 3 years, including only cities with population 5,000 and above)
| Chester: | 166.2 |
| Rock Hill: | 50.2 |
| York: | 138.1 |
| Union: | 106.5 |
| Lancaster: | 574.4 |
| Tega Cay: | 23.8 |
| Fort Mill: | 111.3 |
| Clover: | 131.4 |
| Lake Wylie: | 3.4 |
 The median response time based on all reported fire incidents is 5 minutes. This is lower than the South Carolina median value.
The median response time in Chester, SC compared to nearest cities:
(Note: Based on data for all years, including only cities with at least 500 fire incidents)
| Chester: | 5 minutes |
| Richburg: | 7 minutes |
| Rock Hill: | 6 minutes |
| Great Falls: | 6 minutes |
| York: | 8 minutes |
| Union: | 6 minutes |
| Winnsboro: | 6 minutes |
| Lancaster: | 9 minutes |
| Fort Mill: | 8 minutes |
 29.7% incidents where reported in the morning and 70.3% in the evening. The most fires (16.6%) took place on Tuesday, and the least (12.4%) on Sunday.
 According to the 1,339 fire incidents from years 2004 - 2018 most fires (13.9%) took place during January, and the least (5.8%) in October.
 Out of all 5,573 cases reported during the years 2004 - 2018, the most belonged to the categories: Rescue & EMS (36.4%), Fire (24.0%), and Good Intent Call (15.3%).
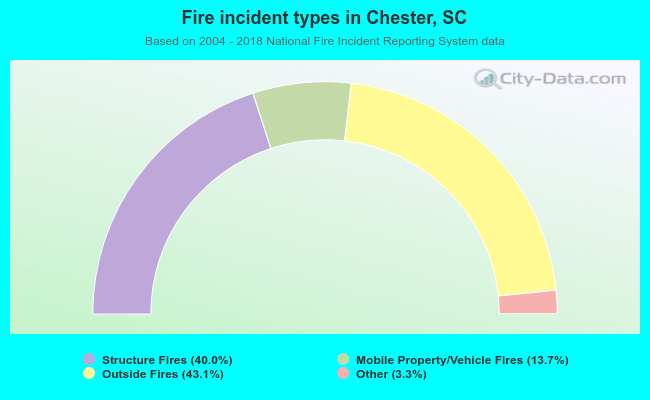 When looking into fire subcategories, the most incidents belonged to: Outside Fires (43.1%), and Structure Fires (40.0%).