Raynham: Fire Incidents, Massachusetts (MA)
Where are fire incidents reported in Raynham, MA
Something went wrong! Please refresh the page.
| Fire incidents reported | |
|---|---|
| Sreet name | Count |
| ROUTE 44 | 366 |
| BROADWAY | 358 |
| PARAMOUNT DRIVE | 128 |
| NORTH MAIN STREET | 124 |
| MILL STREET | 120 |
| SOUTH STREET WEST | 84 |
| KING PHILIP STREET | 70 |
| SOUTH STREET EAST | 58 |
| TITICUT ROAD | 48 |
| SOUTH MAIN STREET | 42 |
| LOCUST STREET | 36 |
| PLEASANT STREET | 36 |
| ORCHARD STREET | 34 |
| THRASHER STREET | 34 |
| BRITTON STREET | 30 |
| CHURCH STREET | 30 |
| JUDSON STREET | 30 |
| CENTER STREET | 28 |
| ELM STREET EAST | 28 |
| MEADOW DRIVE | 24 |
| WHITE STREET | 22 |
| KING STREET | 20 |
| BRIDGE STREET | 16 |
| GARDINER STREET | 16 |
| HALL STREET | 16 |
| HILL STREET | 16 |
| LEONARD STREET | 16 |
| OAK STREET | 16 |
| ROUTE 138 | 16 |
| EDWARD ROAD | 14 |
2002 - 2018 National Fire Incident Reporting System (NFIRS) incidents
- Incident types reported to NFIRS in Raynham, MA
- 6,28650.3%Rescue & EMS
- 2,10016.8%False Alarm
- 1,46311.7%Fire
- 1,1869.5%Hazardous Condition
- 7445.9%Service Call
- 6194.9%Good Intent Call
- 670.5%Special Incident
- 220.2%Severe Weather
- 200.2%Overpressure Rupture
- Fire incident types reported to NFIRS in Raynham, MA
- 63943.7%Outside Fires
- 39627.1%Structure Fires
- 32021.9%Mobile Property/Vehicle Fires
- 1087.4%Other
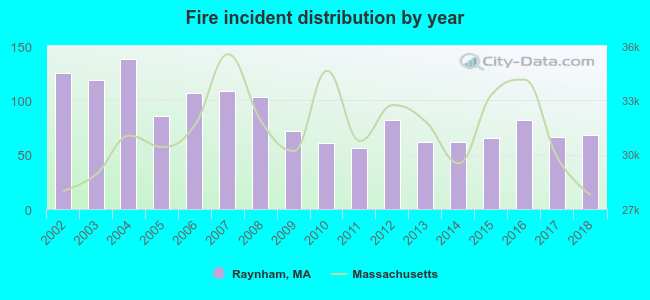 According to the data from the years 2002 - 2018 the average number of fires per year is 86. The highest number of fires - 138 took place in 2004, and the least - 56 in 2011. The data has a decreasing trend.
The average number of yearly fire incidents per 10k residents in Raynham, MA compared to nearest cities:
(Note: Based on data for the last 3 years, including only cities with population 5,000 and above)
| Raynham: | 53.8 |
| Taunton: | 25.0 |
| Bridgewater: | 125.4 |
| West Bridgewater: | 57.4 |
| Berkley: | 25.0 |
| Norton: | 20.0 |
| Lakeville: | 26.4 |
| Dighton: | 12.7 |
| Middleborough: | 34.8 |
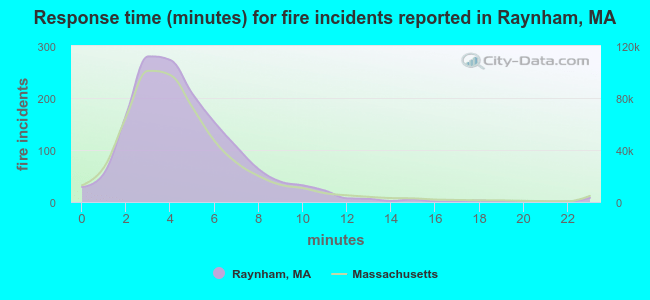 The median response time based on all reported fire incidents is 4 minutes. This is about the same as the state median value.
The median response time in Raynham, MA compared to nearest cities:
(Note: Based on data for all years, including only cities with at least 500 fire incidents)
| Raynham: | 4 minutes |
| Taunton: | 4 minutes |
| Bridgewater: | 5 minutes |
| West Bridgewater: | 4 minutes |
| Norton: | 4 minutes |
| Lakeville: | 6 minutes |
| Middleborough: | 5 minutes |
| East Bridgewater: | 5 minutes |
| Easton: | 5 minutes |
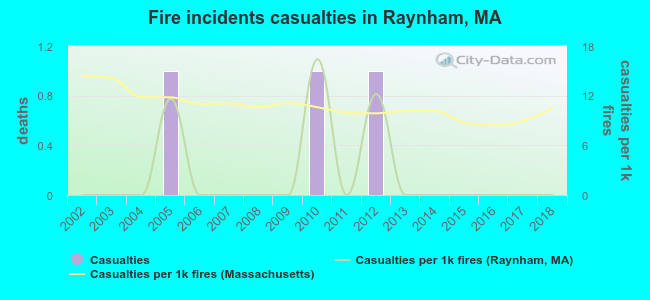 According to the data from the years 2002 - 2018 the average number of fire-related yearly casualties is 0. The highest number of injuries - 1 took place in 2005, and the lowest - 0 in 2002. The data has a constant trend.
The average number of casualties per 1,000 fire incidents is 2. This indicator was the highest - 16 in 2010, and the lowest 0 in 2002. The trend for injuries per 1,000 fires is constant. Compared to the Massachusetts value the number of casualties per 1,000 fire incidents is much lower.
According to the data from the years 2002 - 2018 the average number of fire-related yearly casualties is 0. The highest number of injuries - 1 took place in 2005, and the lowest - 0 in 2002. The data has a constant trend.
The average number of casualties per 1,000 fire incidents is 2. This indicator was the highest - 16 in 2010, and the lowest 0 in 2002. The trend for injuries per 1,000 fires is constant. Compared to the Massachusetts value the number of casualties per 1,000 fire incidents is much lower.Casualties per 1,000 incidents in Raynham, MA compared to nearest cities:
(Note: Based on data for all years, including only cities with at least 500 fire incidents)
| Raynham: | 2.1 |
| Taunton: | 0.8 |
| Bridgewater: | 7.5 |
| West Bridgewater: | 10.4 |
| Norton: | 18.9 |
| Lakeville: | 0.0 |
| Middleborough: | 7.5 |
| East Bridgewater: | 17.7 |
| Easton: | 49.1 |
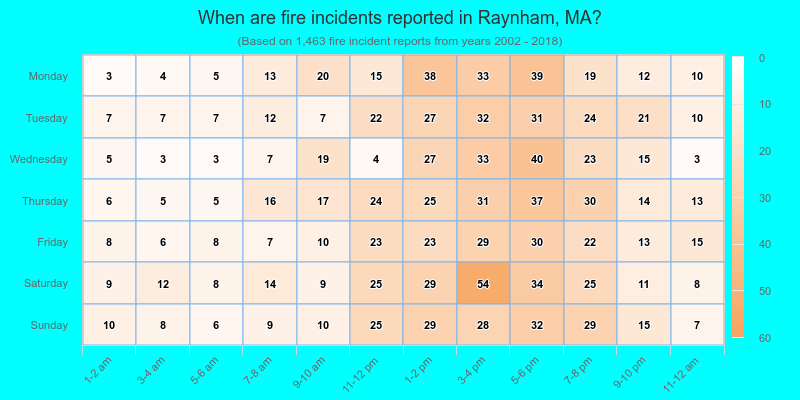
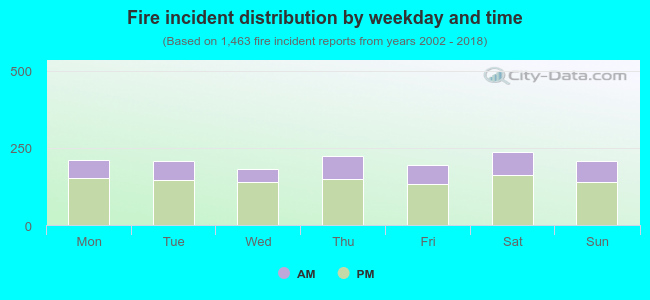 30.3% incidents where reported in the morning and 69.7% in the evening. The most fires (16.3%) took place on Saturday, and the least (12.4%) on Wednesday.
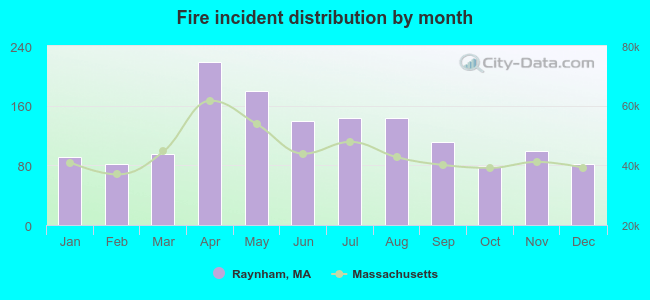 Based on the 1,463 reports from years 2002 - 2018 most fires (15.0%) took place during April, and the least (5.4%) in October.
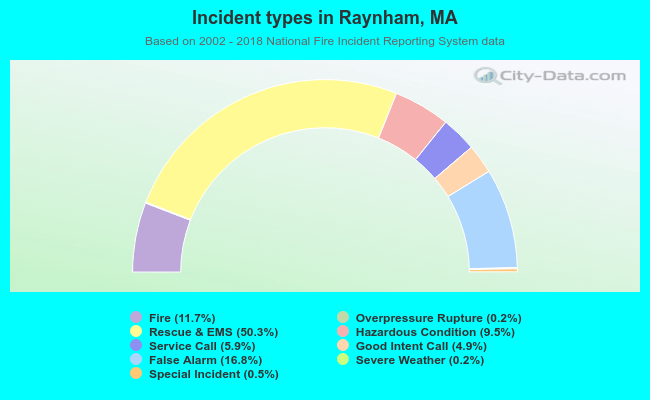 Out of all 12,507 cases reported during the years 2002 - 2018, the most belonged to the categories: Rescue & EMS (50.3%), False Alarm (16.8%), and Fire (11.7%).
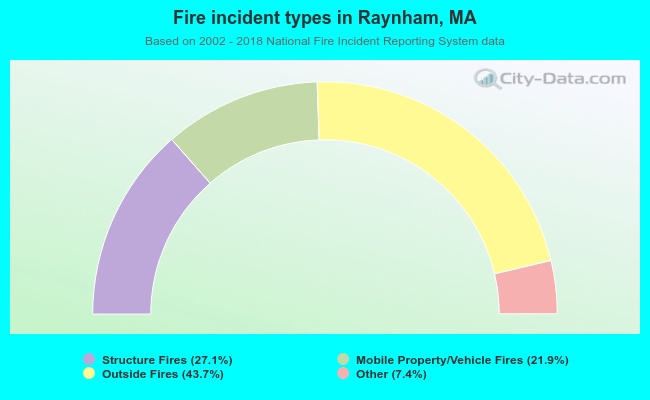 When looking into fire subcategories, the most incidents belonged to: Outside Fires (43.7%), and Structure Fires (27.1%).