Dighton: Fire Incidents, Massachusetts (MA)
Where are fire incidents reported in Dighton, MA
Something went wrong! Please refresh the page.
|
| |||||||||||||||||||||||||||||||||||||||||||||||||||||||||||||||||||||||||||||||||||||||||||||||||||||||||||||
2002 - 2018 National Fire Incident Reporting System (NFIRS) incidents
- Incident types reported to NFIRS in Dighton, MA
- 55230.0%Service Call
- 33718.3%Fire
- 33418.2%Hazardous Condition
- 29516.0%False Alarm
- 19310.5%Rescue & EMS
- 764.1%Good Intent Call
- 331.8%Special Incident
- 110.6%Overpressure Rupture
- 80.4%Severe Weather
- Fire incident types reported to NFIRS in Dighton, MA
- 15345.4%Outside Fires
- 11333.5%Structure Fires
- 5516.3%Mobile Property/Vehicle Fires
- 164.7%Other
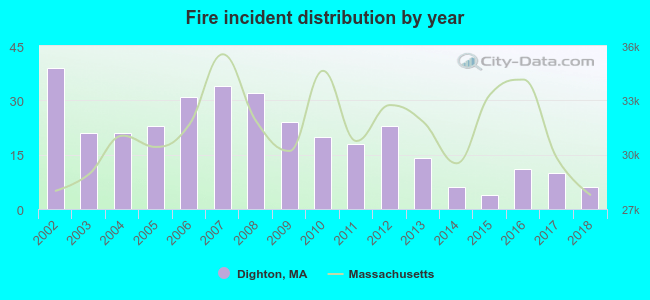 Based on the data from the years 2002 - 2018 the average number of fires per year is 20. The highest number of reported fires - 39 took place in 2002, and the least - 4 in 2015. The data has a declining trend.
The average number of yearly fire incidents per 10k residents in Dighton, MA compared to nearest cities:
(Note: Based on data for the last 3 years, including only cities with population 5,000 and above)
| Dighton: | 12.7 |
| Berkley: | 25.0 |
| Taunton: | 25.0 |
| Somerset: | 22.0 |
| Rehoboth: | 33.9 |
| Freetown: | 4.5 |
| Swansea: | 42.2 |
| Raynham: | 53.8 |
| Lakeville: | 26.4 |
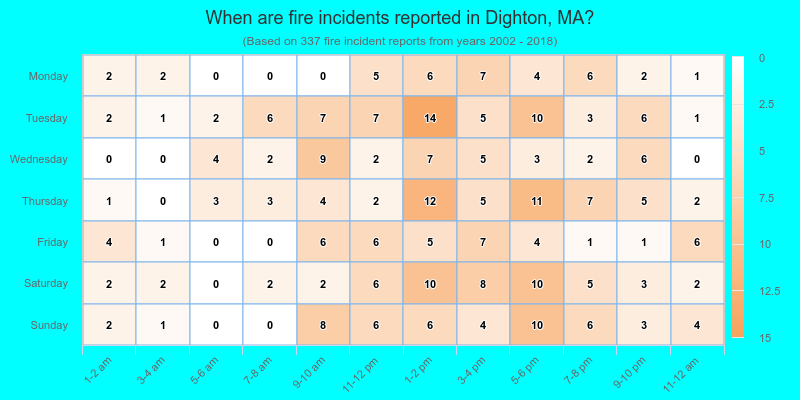
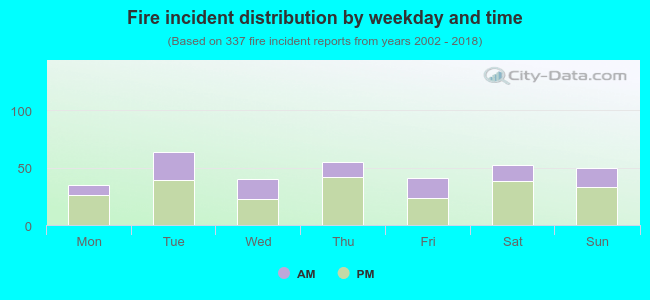 33.2% incidents where reported in the morning and 66.8% in the evening. The most fires (19.0%) took place on Tuesday, and the least (10.4%) on Monday.
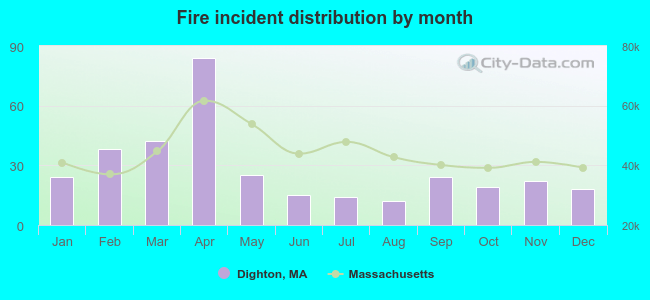 Based on the 337 fire incidents from years 2002 - 2018 most fires (24.9%) took place during April, and the least (3.6%) in August.
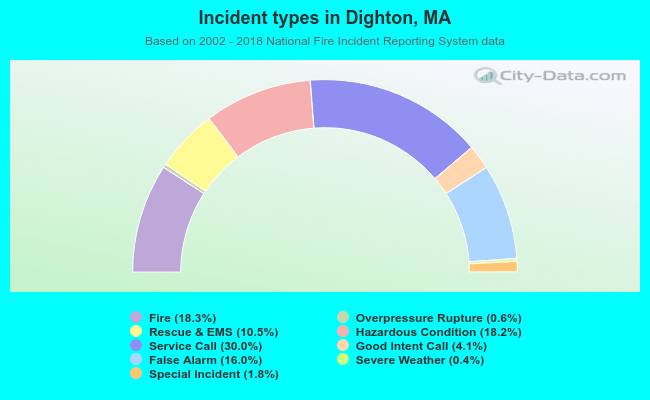 Out of all 1,839 cases reported during the years 2002 - 2018, the most belonged to the categories: Service Call (30.0%), Fire (18.3%), and Hazardous Condition (18.2%).
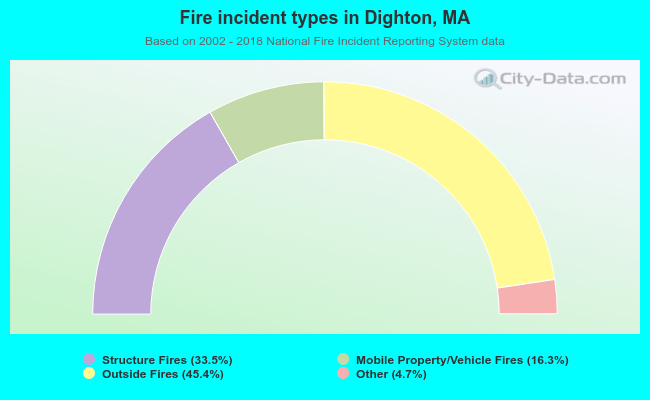 When looking into fire subcategories, the most incidents belonged to: Outside Fires (45.4%), and Structure Fires (33.5%).