Port Huron: Fire Incidents, Michigan (MI)
Where are fire incidents reported in Port Huron, MI
Something went wrong! Please refresh the page.
| Fire incidents reported | |
|---|---|
| Sreet name | Count |
| PINE ST | 130 |
| 24TH ST | 118 |
| 10TH ST | 104 |
| MILITARY ST | 96 |
| KRAFFT RD | 82 |
| WATER ST | 82 |
| PINE GROVE AVE | 76 |
| LAPEER AVE | 70 |
| ELECTRIC AVE | 64 |
| 10TH AVE | 60 |
| 16TH ST | 58 |
| DOVE ST | 56 |
| ERIE ST | 52 |
| COURT ST | 50 |
| ERIE | 50 |
| GRISWOLD ST | 50 |
| MILITARY | 50 |
| 7TH ST | 48 |
| GRATIOT AVE | 46 |
| LAPEER RD | 44 |
| WALL ST | 44 |
| 12TH AVE | 40 |
| 12TH ST | 40 |
| 9TH ST | 40 |
| HOWARD ST | 38 |
| 11TH ST | 36 |
| 17TH ST | 36 |
| CHESTNUT ST | 36 |
| OAK ST | 36 |
| MILITARY ST | 34 |
| Other | 882 |
2002 - 2018 National Fire Incident Reporting System (NFIRS) incidents
- Incident types reported to NFIRS in Port Huron, MI
- 16,29157.6%Rescue & EMS
- 3,97714.1%Hazardous Condition
- 2,6489.4%Fire
- 2,0527.2%Service Call
- 1,7116.0%Good Intent Call
- 1,1804.2%False Alarm
- 4021.4%Special Incident
- 310.1%Severe Weather
- Fire incident types reported to NFIRS in Port Huron, MI
- 1,51157.1%Structure Fires
- 62723.7%Outside Fires
- 39314.8%Mobile Property/Vehicle Fires
- 1174.4%Other
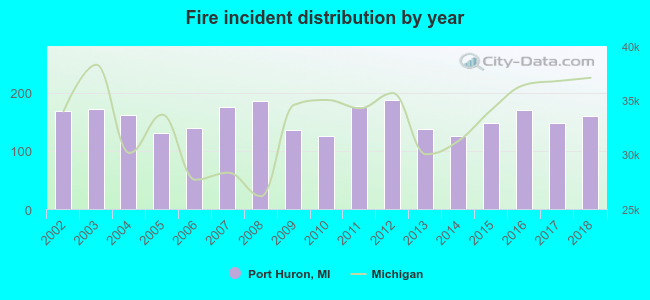 Based on the data from the years 2002 - 2018 the average number of fire incidents per year is 156. The highest number of fire incidents - 187 took place in 2012, and the least - 125 in 2010. The data has a decreasing trend.
The average number of yearly fire incidents per 10k residents in Port Huron, MI compared to nearest cities:
(Note: Based on data for the last 3 years, including only cities with population 5,000 and above)
| Port Huron: | 54.7 |
| Marysville: | 30.6 |
| Richmond: | 2.9 |
| New Baltimore: | 12.2 |
| Mount Clemens: | 50.0 |
| Shelby: | 5.2 |
| Fraser: | 15.7 |
| Rochester: | 16.9 |
| Sterling Heights: | 18.3 |
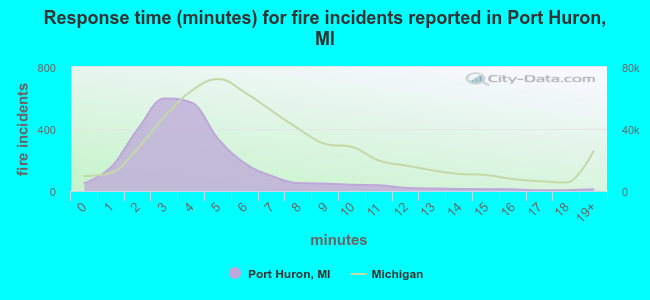 The median response time based on all reported fire incidents is 4 minutes. This is lower than the state median value.
The median response time in Port Huron, MI compared to nearest cities:
(Note: Based on data for all years, including only cities with at least 500 fire incidents)
| Port Huron: | 4 minutes |
| New Baltimore: | 7 minutes |
| Mount Clemens: | 3 minutes |
| Sterling Heights: | 5 minutes |
| St. Clair Shores: | 4 minutes |
| Roseville: | 4 minutes |
| Rochester Hills: | 6 minutes |
| Oxford: | 6 minutes |
| Lake Orion: | 5 minutes |
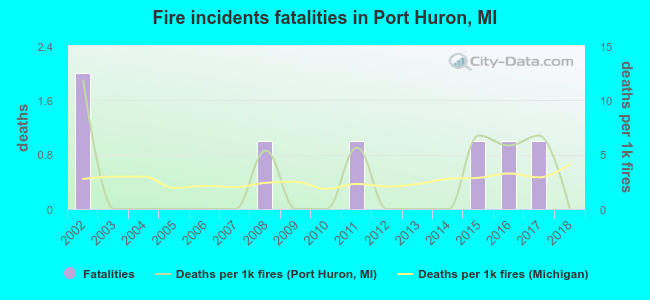 According to the reports from the years 2002 - 2018 the average number of fire-related fatalities per year is 0. The highest number of deaths - 2 took place in 2002, and the lowest - 0 in 2003. The data has a declining trend.
The average number of deaths per 1,000 fire incidents is 2. This indicator was the highest - 12 in 2002, and the lowest 0 in 2003. The trend for fatalities per 1,000 fires is decreasing. Compared to the Michigan value the number of deaths per 1,000 fire incidents is about the same.
According to the reports from the years 2002 - 2018 the average number of fire-related fatalities per year is 0. The highest number of deaths - 2 took place in 2002, and the lowest - 0 in 2003. The data has a declining trend.
The average number of deaths per 1,000 fire incidents is 2. This indicator was the highest - 12 in 2002, and the lowest 0 in 2003. The trend for fatalities per 1,000 fires is decreasing. Compared to the Michigan value the number of deaths per 1,000 fire incidents is about the same.Deaths per 1,000 incidents in Port Huron, MI compared to nearest cities:
(Note: Based on data for all years, including only cities with at least 2,500 fire incidents)
| Port Huron: | 2.6 |
| Sterling Heights: | 2.4 |
| Roseville: | 3.9 |
| Warren: | 2.2 |
| Troy: | 1.8 |
| Pontiac: | 3.8 |
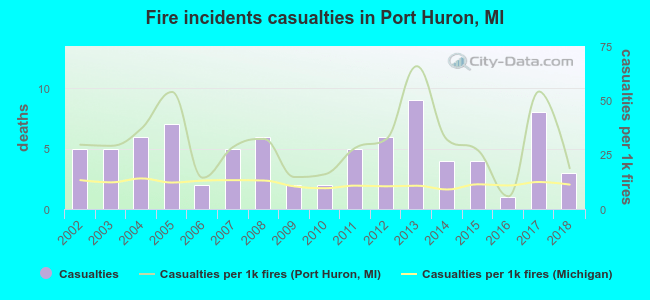 According to the data from the years 2002 - 2018 the average number of fire-related yearly casualties is 5. The highest number of reported injuries - 9 took place in 2013, and the lowest - 1 in 2016. The data has a decreasing trend.
The average number of injuries per 1,000 fires is 31. This indicator was the highest - 66 in 2013, and the lowest 6 in 2016. The trend for casualties per 1,000 fires is dropping. Compared to the Michigan value the number of casualties per 1,000 fires is much higher.
According to the data from the years 2002 - 2018 the average number of fire-related yearly casualties is 5. The highest number of reported injuries - 9 took place in 2013, and the lowest - 1 in 2016. The data has a decreasing trend.
The average number of injuries per 1,000 fires is 31. This indicator was the highest - 66 in 2013, and the lowest 6 in 2016. The trend for casualties per 1,000 fires is dropping. Compared to the Michigan value the number of casualties per 1,000 fires is much higher.Casualties per 1,000 incidents in Port Huron, MI compared to nearest cities:
(Note: Based on data for all years, including only cities with at least 500 fire incidents)
| Port Huron: | 30.2 |
| New Baltimore: | 1.6 |
| Mount Clemens: | 8.5 |
| Sterling Heights: | 49.4 |
| St. Clair Shores: | 16.8 |
| Roseville: | 12.8 |
| Rochester Hills: | 28.1 |
| Oxford: | 9.5 |
| Lake Orion: | 4.6 |
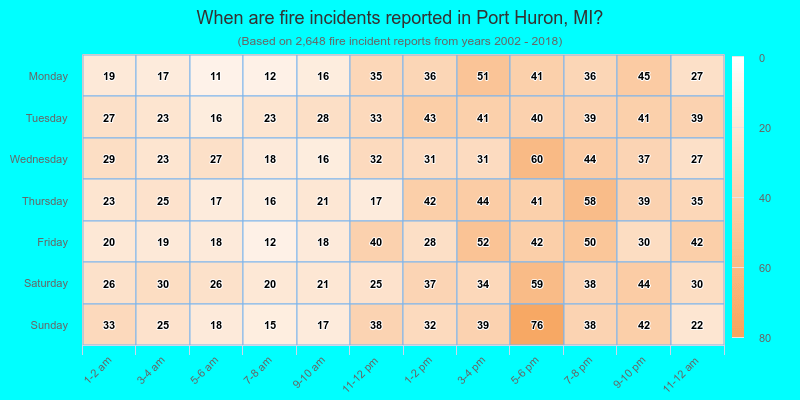
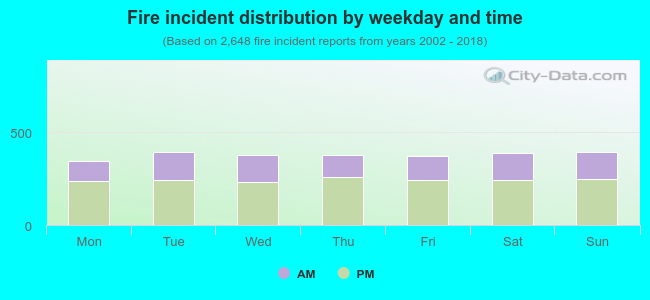 35.7% incidents where reported in the morning and 64.3% in the evening. The most fires (14.9%) took place on Sunday, and the least (13.1%) on Monday.
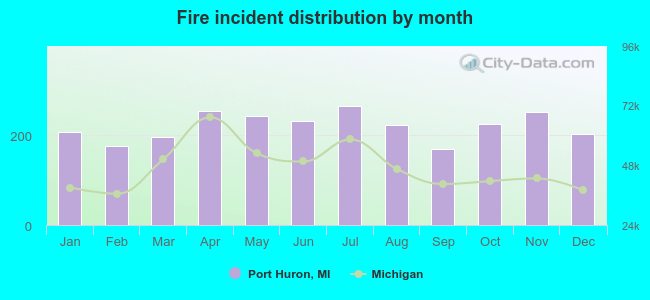 According to the 2,648 reports from years 2002 - 2018 most fires (10.0%) took place during July, and the least (6.4%) in September.
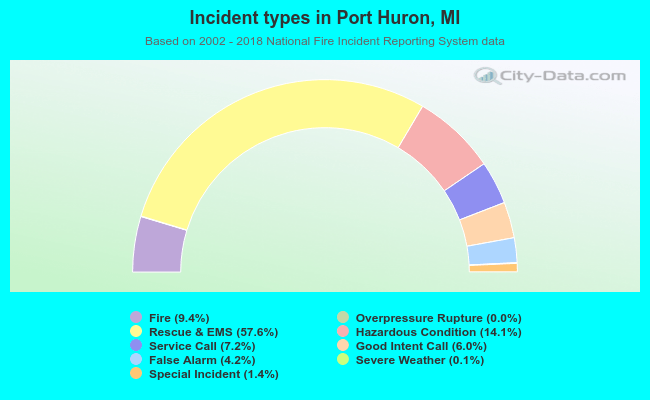 Out of all 28,304 cases reported during the years 2002 - 2018, the most belonged to the categories: Rescue & EMS (57.6%), Hazardous Condition (14.1%), and Fire (9.4%).
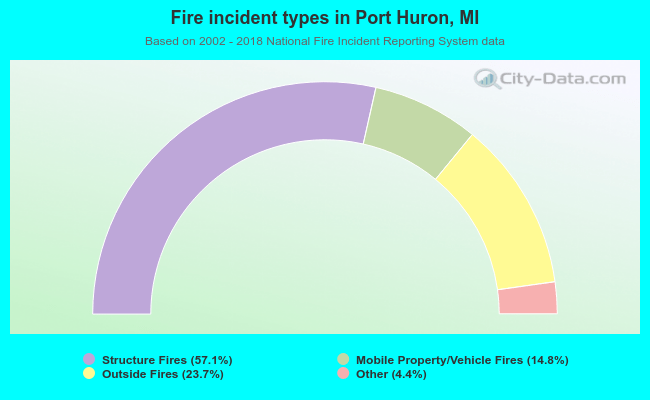 When looking into fire subcategories, the most reports belonged to: Structure Fires (57.1%), and Outside Fires (23.7%).