Pontiac: Fire Incidents, Michigan (MI)
Where are fire incidents reported in Pontiac, MI
Something went wrong! Please refresh the page.
| Fire incidents reported | |
|---|---|
| Sreet name | Count |
| EDITH ST | 178 |
| TELEGRAPH RD | 166 |
| WALTON BLVD | 166 |
| WOODWARD AVE | 164 |
| PERRY ST | 154 |
| BALDWIN RD | 148 |
| CARRIAGE CIRCLE DR | 140 |
| HURON ST | 126 |
| PADDOCK ST | 96 |
| AUBURN AVE | 92 |
| SAGINAW ST | 92 |
| COLUMBIA AVE | 88 |
| WHITTEMORE ST | 88 |
| HOPKINS AVE | 84 |
| UNIVERSITY DR | 78 |
| CESAR CHAVEZ | 76 |
| CARRIAGE DR | 58 |
| JOSLYN RD | 56 |
| RIDGEMONT | 56 |
| SOUTH BLVD | 56 |
| HOWARD ST | 54 |
| MARTIN LUTHER KING JR BLVD | 50 |
| PIKE | 50 |
| EMERSON AVE | 48 |
| MARSHALL ST | 48 |
| BEVERLY AVE | 46 |
| COTTAGE ST | 46 |
| FLORENCE AVE | 46 |
| JOHNSON AVE | 44 |
| NEWMAN LN | 44 |
| Other | 1,334 |
2002 - 2018 National Fire Incident Reporting System (NFIRS) incidents
- Incident types reported to NFIRS in Pontiac, MI
- 13,51351.7%Rescue & EMS
- 3,97215.2%Fire
- 2,92911.2%Good Intent Call
- 2,5369.7%Hazardous Condition
- 1,7086.5%False Alarm
- 1,4545.6%Service Call
- Fire incident types reported to NFIRS in Pontiac, MI
- 2,21955.9%Structure Fires
- 91623.1%Outside Fires
- 69917.6%Mobile Property/Vehicle Fires
- 1383.5%Other
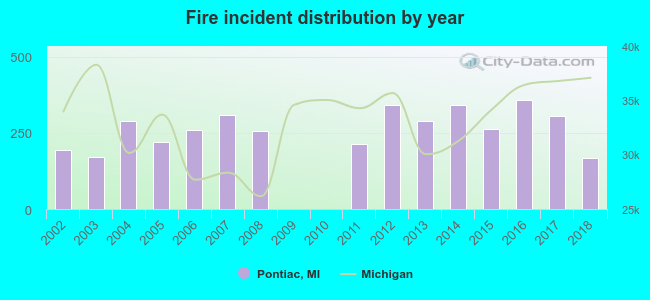 According to the data from the years 2002 - 2018 the average number of fire incidents per year is 234. The highest number of fires - 357 took place in 2016, and the least - 0 in 2009. The data has a dropping trend.
The average number of yearly fire incidents per 10k residents in Pontiac, MI compared to nearest cities:
(Note: Based on data for the last 3 years, including only cities with population 5,000 and above)
| Pontiac: | 46.2 |
| Auburn Hills: | 44.6 |
| Waterford: | 12.0 |
| Bloomfield Township: | 0.2 |
| Rochester Hills: | 16.9 |
| Birmingham: | 15.9 |
| Rochester: | 16.9 |
| Troy: | 21.2 |
| Beverly Hills: | 23.9 |
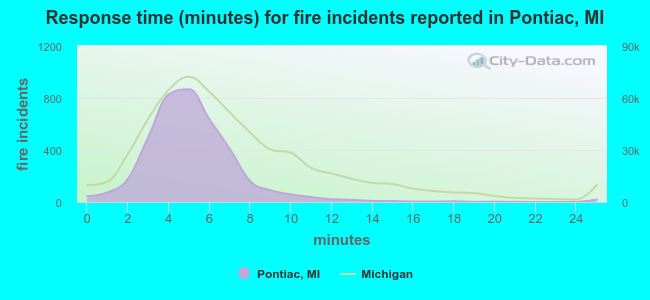 The median response time based on all reported fire incidents is 5 minutes. This is lower compared to the Michigan median value.
The median response time in Pontiac, MI compared to nearest cities:
(Note: Based on data for all years, including only cities with at least 500 fire incidents)
| Pontiac: | 5 minutes |
| Auburn Hills: | 7 minutes |
| Waterford: | 5 minutes |
| Rochester Hills: | 6 minutes |
| Troy: | 7 minutes |
| Lake Orion: | 5 minutes |
| Southfield: | 5 minutes |
| Farmington Hills: | 8 minutes |
| Royal Oak: | 6 minutes |
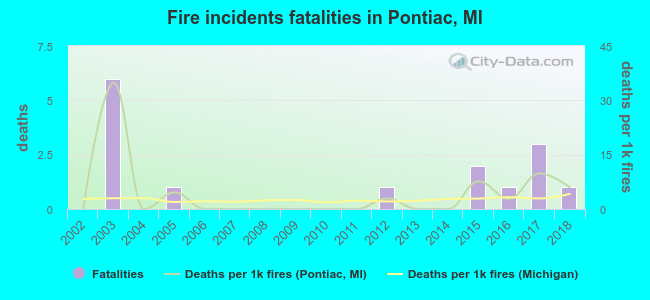 Based on the data from the years 2002 - 2018 the average number of fire-related yearly deaths is 1. The highest number of reported deaths - 6 took place in 2003, and the lowest - 0 in 2002. The data has an increasing trend.
The average number of deaths per 1,000 fires is 4. This indicator was the highest - 35 in 2003, and the lowest 0 in 2002. The trend for deaths per 1,000 incidents is increasing. Compared to the Michigan value the number of deaths per 1,000 fire incidents is higher.
Based on the data from the years 2002 - 2018 the average number of fire-related yearly deaths is 1. The highest number of reported deaths - 6 took place in 2003, and the lowest - 0 in 2002. The data has an increasing trend.
The average number of deaths per 1,000 fires is 4. This indicator was the highest - 35 in 2003, and the lowest 0 in 2002. The trend for deaths per 1,000 incidents is increasing. Compared to the Michigan value the number of deaths per 1,000 fire incidents is higher.Deaths per 1,000 incidents in Pontiac, MI compared to nearest cities:
(Note: Based on data for all years, including only cities with at least 2,500 fire incidents)
| Pontiac: | 3.8 |
| Troy: | 1.8 |
| Southfield: | 3.1 |
| Sterling Heights: | 2.4 |
| Warren: | 2.2 |
| Detroit: | 2.2 |
| Roseville: | 3.9 |
| Dearborn: | 1.8 |
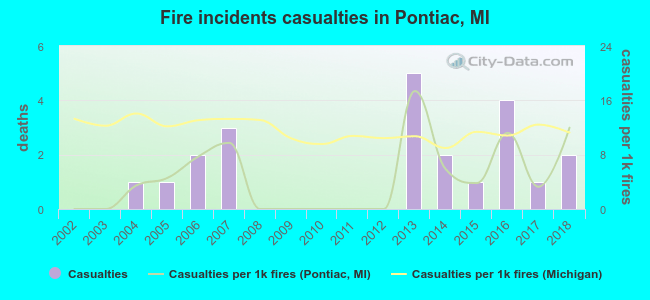 Based on the reports from the years 2002 - 2018 the average number of fire-related yearly casualties is 1. The highest number of casualties - 5 took place in 2013, and the lowest - 0 in 2002. The data has a growing trend.
The average number of injuries per 1,000 fires is 5. This indicator was the highest - 17 in 2013, and the lowest 0 in 2002. The trend for injuries per 1,000 fire incidents is growing. Compared to the Michigan value the number of casualties per 1,000 fires is much lower.
Based on the reports from the years 2002 - 2018 the average number of fire-related yearly casualties is 1. The highest number of casualties - 5 took place in 2013, and the lowest - 0 in 2002. The data has a growing trend.
The average number of injuries per 1,000 fires is 5. This indicator was the highest - 17 in 2013, and the lowest 0 in 2002. The trend for injuries per 1,000 fire incidents is growing. Compared to the Michigan value the number of casualties per 1,000 fires is much lower.Casualties per 1,000 incidents in Pontiac, MI compared to nearest cities:
(Note: Based on data for all years, including only cities with at least 500 fire incidents)
| Pontiac: | 5.5 |
| Auburn Hills: | 11.1 |
| Waterford: | 24.0 |
| Rochester Hills: | 28.1 |
| Troy: | 18.0 |
| Lake Orion: | 4.6 |
| Southfield: | 14.3 |
| Farmington Hills: | 48.2 |
| Royal Oak: | 24.1 |
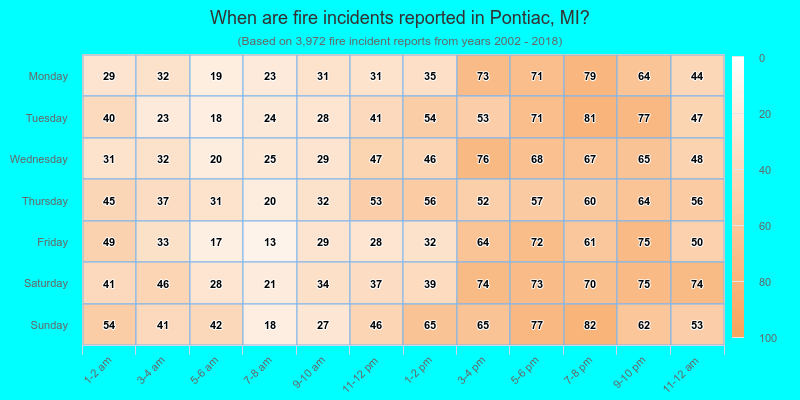
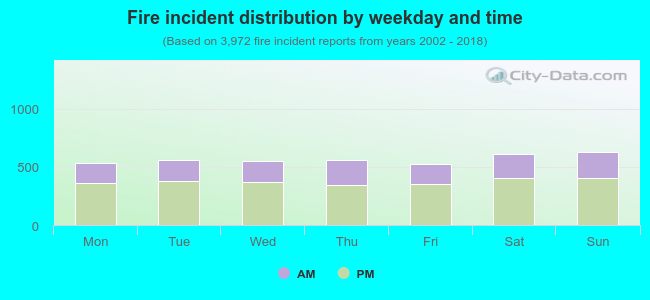 33.9% incidents where reported in the morning and 66.1% in the evening. The most fires (15.9%) took place on Sunday, and the least (13.2%) on Friday.
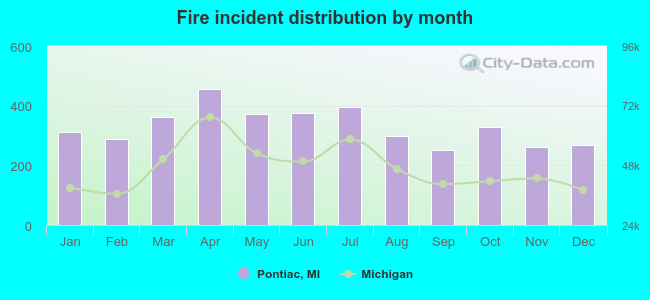 Based on the 3,972 fire incident reports from years 2002 - 2018 most fires (11.5%) took place during April, and the least (6.4%) in September.
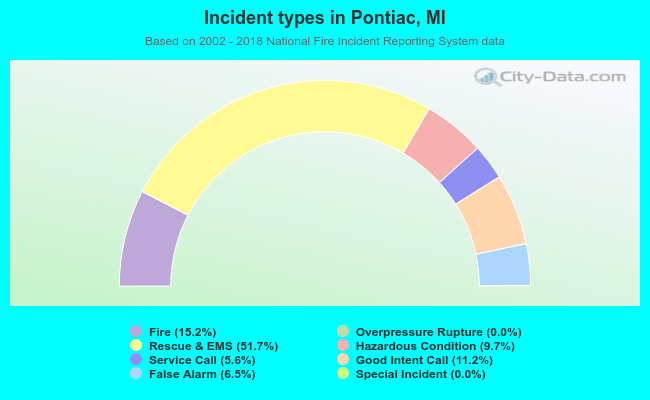 Out of all 26,137 cases reported during the years 2002 - 2018, the most belonged to the categories: Rescue & EMS (51.7%), Fire (15.2%), and Good Intent Call (11.2%).
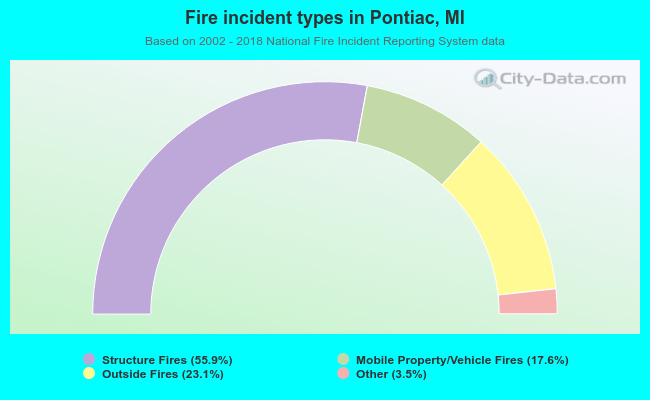 When looking into fire subcategories, the most incidents belonged to: Structure Fires (55.9%), and Outside Fires (23.1%).