Pittsburgh: Fire Incidents, Pennsylvania (PA)
Where are fire incidents reported in Pittsburgh, PA
Something went wrong! Please refresh the page.
| Fire incidents reported | |
|---|---|
| Sreet name | Count |
| MCKNIGHT RD | 394 |
| BABCOCK BLVD | 232 |
| WASHINGTON RD | 230 |
| PENN AV | 164 |
| BROWNSVILLE RD | 142 |
| BOWER HILL RD | 100 |
| CENTRE AVE | 100 |
| PARK HILL DR | 100 |
| CENTRE AV | 94 |
| PERRY HWY | 94 |
| PERRYSVILLE AV | 92 |
| FORBES AV | 82 |
| GREENTREE RD | 80 |
| 5TH AV | 78 |
| BEDFORD AV | 78 |
| CARSON ST | 72 |
| DUNCAN AVE | 68 |
| FISHER ST | 68 |
| KEEPORT DR | 68 |
| VILLAGE DR | 68 |
| COLUMBO ST | 66 |
| NORTH AVE | 66 |
| HIGHLAND PINES DR | 64 |
| LINCOLN AVE | 64 |
| PERRY HIGHWAY | 64 |
| CRESSWELL ST | 62 |
| PENN AVE PGH | 62 |
| BUTLER ST | 58 |
| ELMORE SQ | 58 |
| BENTLEY DR | 56 |
| Other | 12,807 |
2003 - 2018 National Fire Incident Reporting System (NFIRS) incidents
- Incident types reported to NFIRS in Pittsburgh, PA
- 47,40532.3%Rescue & EMS
- 35,28624.0%Hazardous Condition
- 23,97816.3%Good Intent Call
- 15,83110.8%Fire
- 14,97510.2%False Alarm
- 8,2825.6%Service Call
- 4370.3%Severe Weather
- 3370.2%Special Incident
- 2380.2%Overpressure Rupture
- Fire incident types reported to NFIRS in Pittsburgh, PA
- 7,72848.8%Structure Fires
- 4,79930.3%Outside Fires
- 1,96112.4%Mobile Property/Vehicle Fires
- 1,3438.5%Other
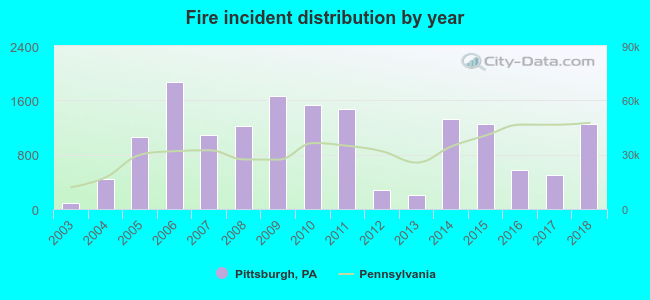 According to the data from the years 2003 - 2018 the average number of fire incidents per year is 989. The highest number of reported fire incidents - 1,866 took place in 2006, and the least - 86 in 2003. The data has a rising trend.
The average number of yearly fire incidents per 10k residents in Pittsburgh, PA compared to nearest cities:
(Note: Based on data for the last 3 years, including only cities with population 5,000 and above)
| Pittsburgh: | 25.4 |
| Dormont: | 26.6 |
| Brentwood: | 24.4 |
| Crafton: | 25.4 |
| McKees Rocks: | 72.8 |
| Swissvale: | 58.0 |
| Wilkinsburg: | 31.6 |
| Munhall: | 46.6 |
| Bellevue: | 45.8 |
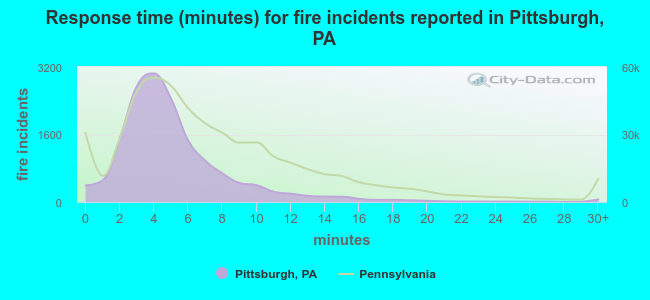 The median response time based on all reported fire incidents is 4 minutes. This is lower than the Pennsylvania median value.
The median response time in Pittsburgh, PA compared to nearest cities:
(Note: Based on data for all years, including only cities with at least 500 fire incidents)
| Pittsburgh: | 4 minutes |
| West Mifflin: | 7 minutes |
| Penn Hills: | 7 minutes |
| Bridgeville: | 7 minutes |
| McKeesport: | 5 minutes |
| Monroeville: | 6 minutes |
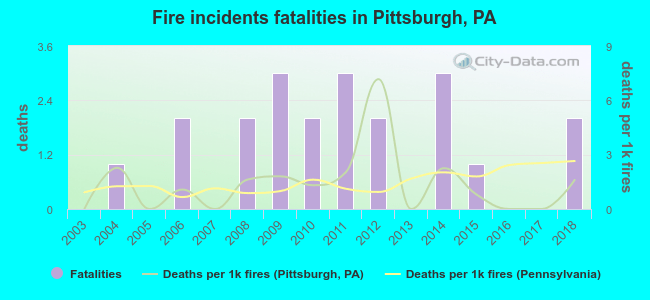 Based on the reports from the years 2003 - 2018 the average number of fire-related fatalities per year is 1. The highest number of reported deaths - 3 took place in 2009, and the lowest - 0 in 2003. The data has a growing trend.
The average number of fatalities per 1,000 fire incidents is 1. This indicator was the highest - 7 in 2012, and the lowest 0 in 2003. The trend for fatalities per 1,000 fire incidents is rising. Compared to the Pennsylvania value the number of deaths per 1,000 fires is lower.
Based on the reports from the years 2003 - 2018 the average number of fire-related fatalities per year is 1. The highest number of reported deaths - 3 took place in 2009, and the lowest - 0 in 2003. The data has a growing trend.
The average number of fatalities per 1,000 fire incidents is 1. This indicator was the highest - 7 in 2012, and the lowest 0 in 2003. The trend for fatalities per 1,000 fire incidents is rising. Compared to the Pennsylvania value the number of deaths per 1,000 fires is lower.Deaths per 1,000 incidents in Pittsburgh, PA compared to nearest cities:
(Note: Based on data for all years, including only cities with at least 2,500 fire incidents)
| Pittsburgh: | 1.3 |
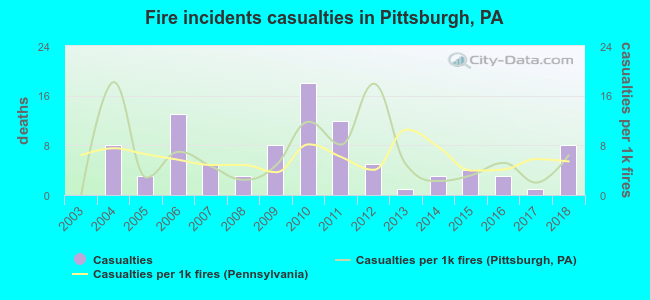 Based on the data from the years 2003 - 2018 the average number of fire-related yearly casualties is 6. The highest number of injuries - 18 took place in 2010, and the lowest - 0 in 2003. The data has an increasing trend.
The average number of injuries per 1,000 fires is 6. This indicator was the highest - 18 in 2004, and the lowest 0 in 2003. The trend for casualties per 1,000 incidents is increasing. Compared to the Pennsylvania value the number of casualties per 1,000 incidents is about the same.
Based on the data from the years 2003 - 2018 the average number of fire-related yearly casualties is 6. The highest number of injuries - 18 took place in 2010, and the lowest - 0 in 2003. The data has an increasing trend.
The average number of injuries per 1,000 fires is 6. This indicator was the highest - 18 in 2004, and the lowest 0 in 2003. The trend for casualties per 1,000 incidents is increasing. Compared to the Pennsylvania value the number of casualties per 1,000 incidents is about the same.Casualties per 1,000 incidents in Pittsburgh, PA compared to nearest cities:
(Note: Based on data for all years, including only cities with at least 500 fire incidents)
| Pittsburgh: | 6.0 |
| West Mifflin: | 5.2 |
| Penn Hills: | 3.4 |
| Bridgeville: | 0.0 |
| McKeesport: | 5.2 |
| Monroeville: | 0.0 |
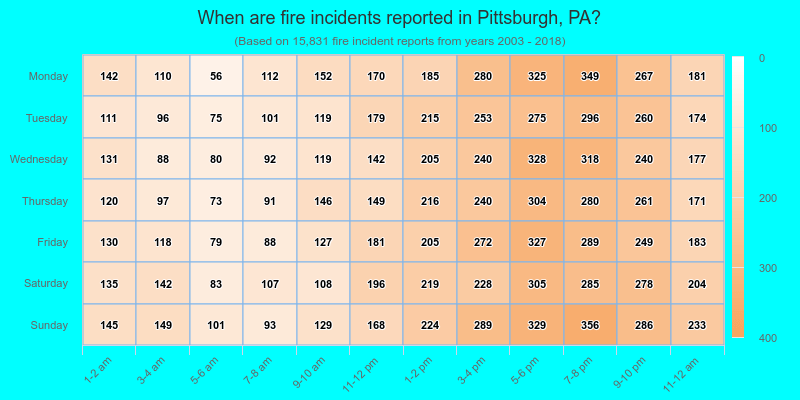
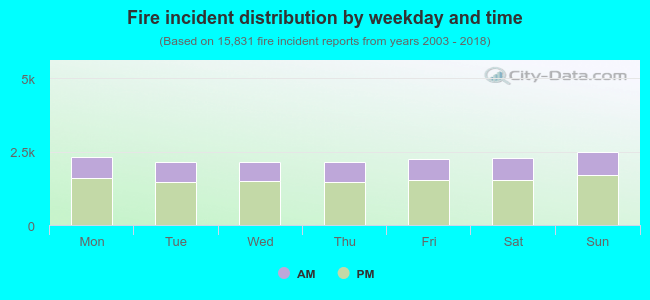 31.8% incidents where reported in the morning and 68.2% in the evening. The most fires (15.8%) took place on Sunday, and the least (13.6%) on Thursday.
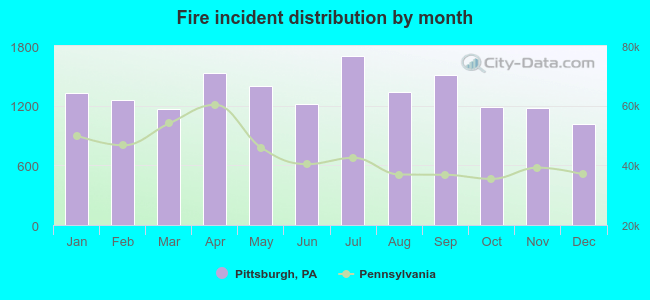 According to the 15,831 reports from years 2003 - 2018 most fires (10.7%) took place during July, and the least (6.4%) in December.
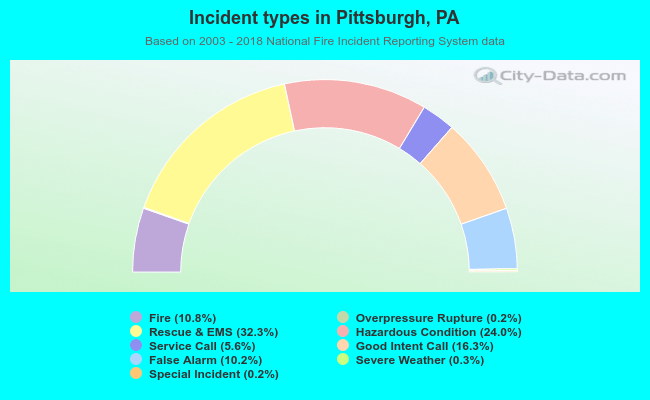 Out of all 146,769 cases reported during the years 2003 - 2018, the most belonged to the categories: Rescue & EMS (32.3%), Hazardous Condition (24.0%), and Good Intent Call (16.3%).
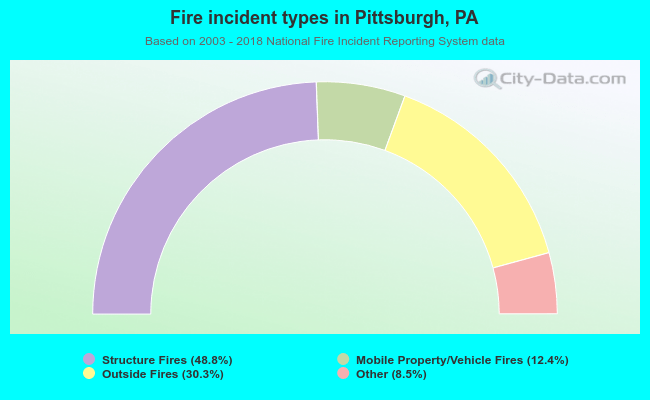 When looking into fire subcategories, the most incidents belonged to: Structure Fires (48.8%), and Outside Fires (30.3%).