Bridgeville: Fire Incidents, Pennsylvania (PA)
Where are fire incidents reported in Bridgeville, PA
Something went wrong! Please refresh the page.
|
| |||||||||||||||||||||||||||||||||||||||||||||||||||||||||||||||||||||||||||||||||||||||||||||||||||||||||||||
2003 - 2018 National Fire Incident Reporting System (NFIRS) incidents
- Incident types reported to NFIRS in Bridgeville, PA
- 75229.5%Hazardous Condition
- 60923.9%Fire
- 31112.2%Good Intent Call
- 29211.5%Rescue & EMS
- 29011.4%Service Call
- 26710.5%False Alarm
- 150.6%Severe Weather
- 100.4%Overpressure Rupture
- Fire incident types reported to NFIRS in Bridgeville, PA
- 38362.9%Structure Fires
- 9114.9%Mobile Property/Vehicle Fires
- 8914.6%Outside Fires
- 467.6%Other
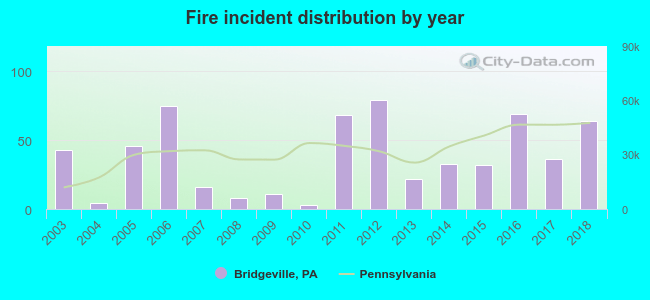 Based on the data from the years 2003 - 2018 the average number of fires per year is 38. The highest number of fire incidents - 79 took place in 2012, and the least - 3 in 2010. The data has a growing trend.
The average number of yearly fire incidents per 10k residents in Bridgeville, PA compared to nearest cities:
(Note: Based on data for the last 3 years, including only cities with population 5,000 and above)
| Bridgeville: | 110.1 |
| Scott Township: | 10.7 |
| Carnegie: | 28.2 |
| Bethel Park: | 12.3 |
| Dormont: | 26.6 |
| Castle Shannon: | 2.8 |
| Crafton: | 25.4 |
| Whitehall: | 1.8 |
| Robinson Township: | 5.5 |
 The median response time based on all reported fire incidents is 7 minutes. This is comparable to the Pennsylvania median value.
The median response time in Bridgeville, PA compared to nearest cities:
(Note: Based on data for all years, including only cities with at least 500 fire incidents)
| Bridgeville: | 7 minutes |
| Pittsburgh: | 4 minutes |
| West Mifflin: | 7 minutes |
| Clairton: | 6 minutes |
 34.5% incidents where reported in the morning and 65.5% in the evening. The most fires (16.9%) took place on Thursday, and the least (12.8%) on Sunday.
 According to the 609 fires from years 2003 - 2018 most fires (10.7%) took place during March, and the least (5.6%) in October.
 Out of all 2,548 cases reported during the years 2003 - 2018, the most belonged to the categories: Hazardous Condition (29.5%), Fire (23.9%), and Good Intent Call (12.2%).
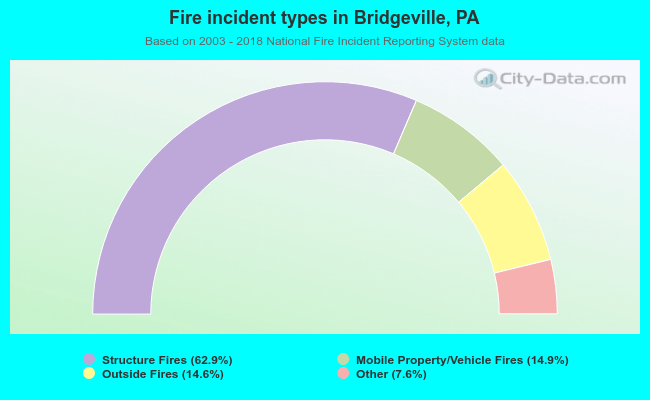 When looking into fire subcategories, the most incidents belonged to: Structure Fires (62.9%), and Mobile Property/Vehicle Fires (14.9%).